Immigrants from Micronesia vs Immigrants from Zaire Median Male Earnings
COMPARE
Immigrants from Micronesia
Immigrants from Zaire
Median Male Earnings
Median Male Earnings Comparison
Immigrants from Micronesia
Immigrants from Zaire
$47,177
MEDIAN MALE EARNINGS
0.1/ 100
METRIC RATING
298th/ 347
METRIC RANK
$47,070
MEDIAN MALE EARNINGS
0.1/ 100
METRIC RATING
299th/ 347
METRIC RANK
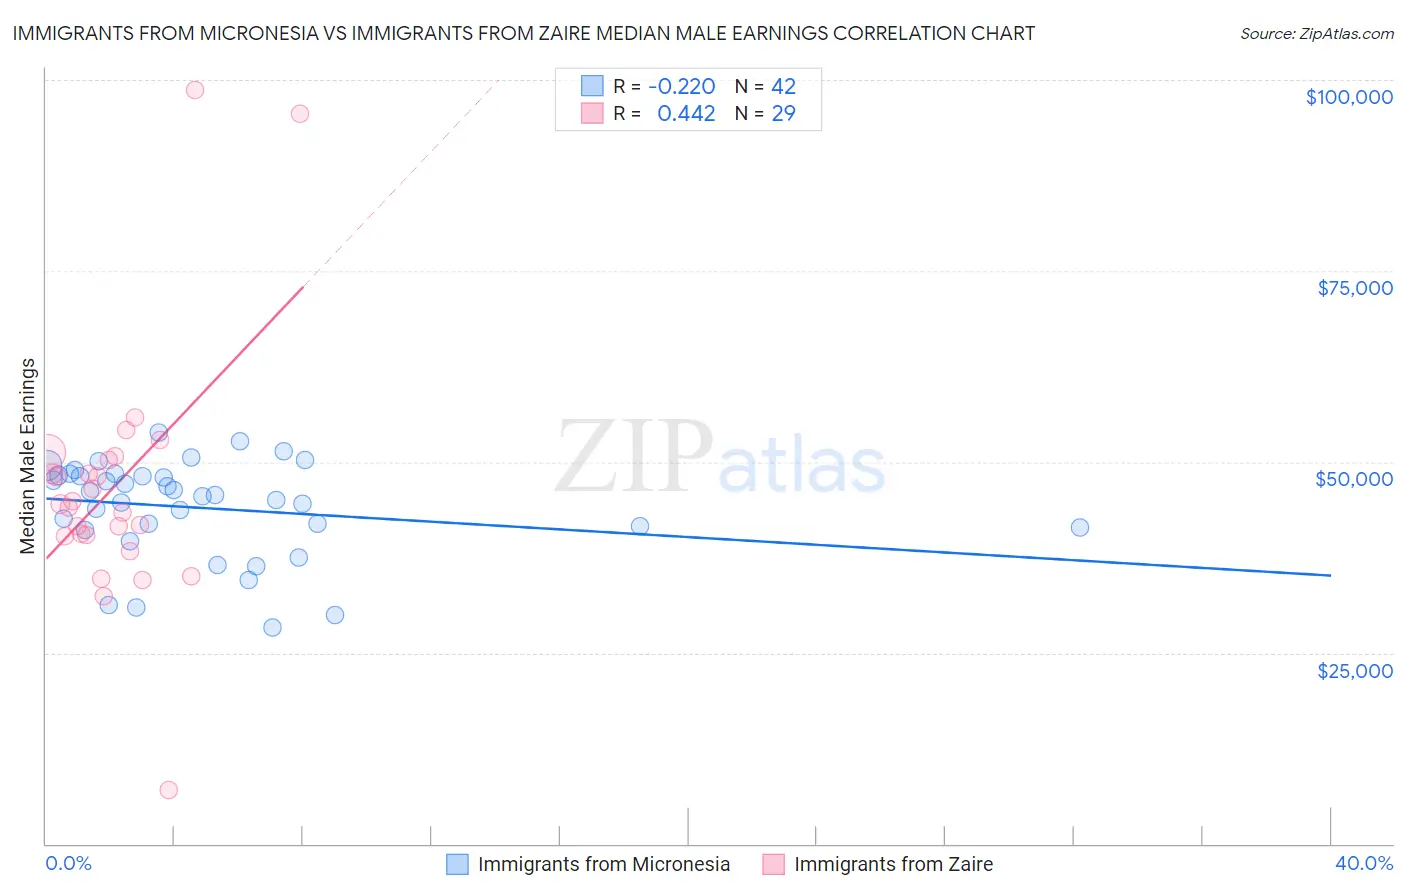
Immigrants from Micronesia vs Immigrants from Zaire Median Male Earnings Correlation Chart
The statistical analysis conducted on geographies consisting of 61,605,252 people shows a weak negative correlation between the proportion of Immigrants from Micronesia and median male earnings in the United States with a correlation coefficient (R) of -0.220 and weighted average of $47,177. Similarly, the statistical analysis conducted on geographies consisting of 107,252,506 people shows a moderate positive correlation between the proportion of Immigrants from Zaire and median male earnings in the United States with a correlation coefficient (R) of 0.442 and weighted average of $47,070, a difference of 0.23%.
Median Male Earnings Correlation Summary
| Measurement | Immigrants from Micronesia | Immigrants from Zaire |
| Minimum | $28,299 | $7,065 |
| Maximum | $53,866 | $98,750 |
| Range | $25,567 | $91,685 |
| Mean | $43,968 | $46,699 |
| Median | $45,525 | $44,438 |
| Interquartile 25% (IQ1) | $41,333 | $40,386 |
| Interquartile 75% (IQ3) | $48,203 | $50,511 |
| Interquartile Range (IQR) | $6,870 | $10,125 |
| Standard Deviation (Sample) | $6,332 | $16,725 |
| Standard Deviation (Population) | $6,257 | $16,434 |
Demographics Similar to Immigrants from Micronesia and Immigrants from Zaire by Median Male Earnings
In terms of median male earnings, the demographic groups most similar to Immigrants from Micronesia are Dominican ($47,204, a difference of 0.060%), Inupiat ($47,281, a difference of 0.22%), U.S. Virgin Islander ($47,066, a difference of 0.23%), Immigrants from Latin America ($46,941, a difference of 0.50%), and Central American Indian ($47,433, a difference of 0.54%). Similarly, the demographic groups most similar to Immigrants from Zaire are U.S. Virgin Islander ($47,066, a difference of 0.010%), Dominican ($47,204, a difference of 0.28%), Immigrants from Latin America ($46,941, a difference of 0.28%), Inupiat ($47,281, a difference of 0.45%), and Seminole ($46,783, a difference of 0.61%).
| Demographics | Rating | Rank | Median Male Earnings |
| Shoshone | 0.2 /100 | #288 | Tragic $47,930 |
| Chickasaw | 0.1 /100 | #289 | Tragic $47,832 |
| Immigrants | Belize | 0.1 /100 | #290 | Tragic $47,809 |
| Choctaw | 0.1 /100 | #291 | Tragic $47,729 |
| Immigrants | Dominica | 0.1 /100 | #292 | Tragic $47,651 |
| Indonesians | 0.1 /100 | #293 | Tragic $47,503 |
| Immigrants | Nicaragua | 0.1 /100 | #294 | Tragic $47,482 |
| Central American Indians | 0.1 /100 | #295 | Tragic $47,433 |
| Inupiat | 0.1 /100 | #296 | Tragic $47,281 |
| Dominicans | 0.1 /100 | #297 | Tragic $47,204 |
| Immigrants | Micronesia | 0.1 /100 | #298 | Tragic $47,177 |
| Immigrants | Zaire | 0.1 /100 | #299 | Tragic $47,070 |
| U.S. Virgin Islanders | 0.1 /100 | #300 | Tragic $47,066 |
| Immigrants | Latin America | 0.1 /100 | #301 | Tragic $46,941 |
| Seminole | 0.1 /100 | #302 | Tragic $46,783 |
| Yaqui | 0.1 /100 | #303 | Tragic $46,777 |
| Bangladeshis | 0.1 /100 | #304 | Tragic $46,744 |
| Guatemalans | 0.0 /100 | #305 | Tragic $46,736 |
| Dutch West Indians | 0.0 /100 | #306 | Tragic $46,656 |
| Immigrants | Dominican Republic | 0.0 /100 | #307 | Tragic $46,655 |
| Ottawa | 0.0 /100 | #308 | Tragic $46,611 |