Immigrants from Latvia vs Blackfeet Unemployment Among Ages 20 to 24 years
COMPARE
Immigrants from Latvia
Blackfeet
Unemployment Among Ages 20 to 24 years
Unemployment Among Ages 20 to 24 years Comparison
Immigrants from Latvia
Blackfeet
10.1%
UNEMPLOYMENT AMONG AGES 20 TO 24 YEARS
93.2/ 100
METRIC RATING
108th/ 347
METRIC RANK
12.0%
UNEMPLOYMENT AMONG AGES 20 TO 24 YEARS
0.0/ 100
METRIC RATING
297th/ 347
METRIC RANK
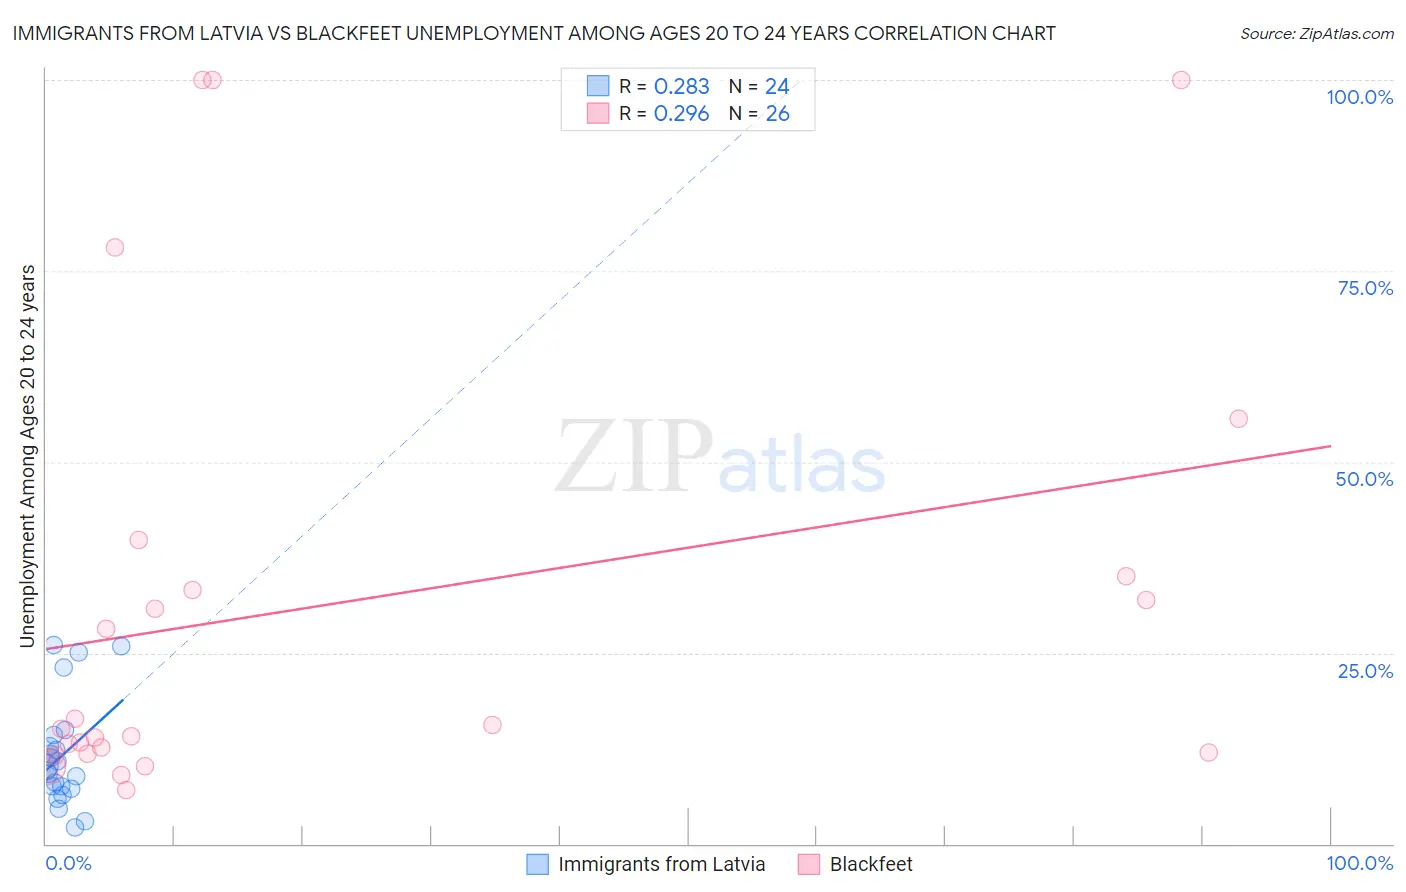
Immigrants from Latvia vs Blackfeet Unemployment Among Ages 20 to 24 years Correlation Chart
The statistical analysis conducted on geographies consisting of 112,554,162 people shows a weak positive correlation between the proportion of Immigrants from Latvia and unemployment rate among population between the ages 20 and 24 in the United States with a correlation coefficient (R) of 0.283 and weighted average of 10.1%. Similarly, the statistical analysis conducted on geographies consisting of 301,283,608 people shows a weak positive correlation between the proportion of Blackfeet and unemployment rate among population between the ages 20 and 24 in the United States with a correlation coefficient (R) of 0.296 and weighted average of 12.0%, a difference of 19.1%.
Unemployment Among Ages 20 to 24 years Correlation Summary
| Measurement | Immigrants from Latvia | Blackfeet |
| Minimum | 2.1% | 7.1% |
| Maximum | 26.0% | 100.0% |
| Range | 23.9% | 92.9% |
| Mean | 11.6% | 31.5% |
| Median | 9.8% | 15.3% |
| Interquartile 25% (IQ1) | 7.3% | 11.9% |
| Interquartile 75% (IQ3) | 13.5% | 35.1% |
| Interquartile Range (IQR) | 6.2% | 23.2% |
| Standard Deviation (Sample) | 6.9% | 30.0% |
| Standard Deviation (Population) | 6.8% | 29.4% |
Similar Demographics by Unemployment Among Ages 20 to 24 years
Demographics Similar to Immigrants from Latvia by Unemployment Among Ages 20 to 24 years
In terms of unemployment among ages 20 to 24 years, the demographic groups most similar to Immigrants from Latvia are Filipino (10.1%, a difference of 0.0%), Immigrants from Spain (10.1%, a difference of 0.010%), Iroquois (10.1%, a difference of 0.030%), Immigrants from Indonesia (10.1%, a difference of 0.070%), and Northern European (10.1%, a difference of 0.080%).
| Demographics | Rating | Rank | Unemployment Among Ages 20 to 24 years |
| Laotians | 95.1 /100 | #101 | Exceptional 10.0% |
| Immigrants | Argentina | 94.9 /100 | #102 | Exceptional 10.0% |
| Irish | 94.3 /100 | #103 | Exceptional 10.0% |
| Immigrants | Chile | 94.0 /100 | #104 | Exceptional 10.0% |
| Immigrants | Hungary | 94.0 /100 | #105 | Exceptional 10.0% |
| Pennsylvania Germans | 93.9 /100 | #106 | Exceptional 10.0% |
| Iroquois | 93.4 /100 | #107 | Exceptional 10.1% |
| Immigrants | Latvia | 93.2 /100 | #108 | Exceptional 10.1% |
| Filipinos | 93.2 /100 | #109 | Exceptional 10.1% |
| Immigrants | Spain | 93.1 /100 | #110 | Exceptional 10.1% |
| Immigrants | Indonesia | 92.7 /100 | #111 | Exceptional 10.1% |
| Northern Europeans | 92.7 /100 | #112 | Exceptional 10.1% |
| German Russians | 92.4 /100 | #113 | Exceptional 10.1% |
| Ottawa | 90.8 /100 | #114 | Exceptional 10.1% |
| Immigrants | Morocco | 90.5 /100 | #115 | Exceptional 10.1% |
Demographics Similar to Blackfeet by Unemployment Among Ages 20 to 24 years
In terms of unemployment among ages 20 to 24 years, the demographic groups most similar to Blackfeet are Cajun (12.0%, a difference of 0.010%), Immigrants from Armenia (12.0%, a difference of 0.040%), Immigrants from Belize (12.0%, a difference of 0.22%), Immigrants from Ghana (11.9%, a difference of 0.25%), and Lumbee (12.0%, a difference of 0.45%).
| Demographics | Rating | Rank | Unemployment Among Ages 20 to 24 years |
| Immigrants | Caribbean | 0.0 /100 | #290 | Tragic 11.8% |
| Central American Indians | 0.0 /100 | #291 | Tragic 11.9% |
| Immigrants | Senegal | 0.0 /100 | #292 | Tragic 11.9% |
| Immigrants | Ghana | 0.0 /100 | #293 | Tragic 11.9% |
| Immigrants | Belize | 0.0 /100 | #294 | Tragic 12.0% |
| Immigrants | Armenia | 0.0 /100 | #295 | Tragic 12.0% |
| Cajuns | 0.0 /100 | #296 | Tragic 12.0% |
| Blackfeet | 0.0 /100 | #297 | Tragic 12.0% |
| Lumbee | 0.0 /100 | #298 | Tragic 12.0% |
| Apache | 0.0 /100 | #299 | Tragic 12.0% |
| Spanish American Indians | 0.0 /100 | #300 | Tragic 12.1% |
| Immigrants | Sierra Leone | 0.0 /100 | #301 | Tragic 12.1% |
| Immigrants | Cabo Verde | 0.0 /100 | #302 | Tragic 12.2% |
| Haitians | 0.0 /100 | #303 | Tragic 12.2% |
| Immigrants | West Indies | 0.0 /100 | #304 | Tragic 12.3% |