Immigrants from Latin America vs Kiowa Births to Unmarried Women
COMPARE
Immigrants from Latin America
Kiowa
Births to Unmarried Women
Births to Unmarried Women Comparison
Immigrants from Latin America
Kiowa
37.1%
BIRTHS TO UNMARRIED WOMEN
0.1/ 100
METRIC RATING
278th/ 347
METRIC RANK
43.1%
BIRTHS TO UNMARRIED WOMEN
0.0/ 100
METRIC RATING
332nd/ 347
METRIC RANK
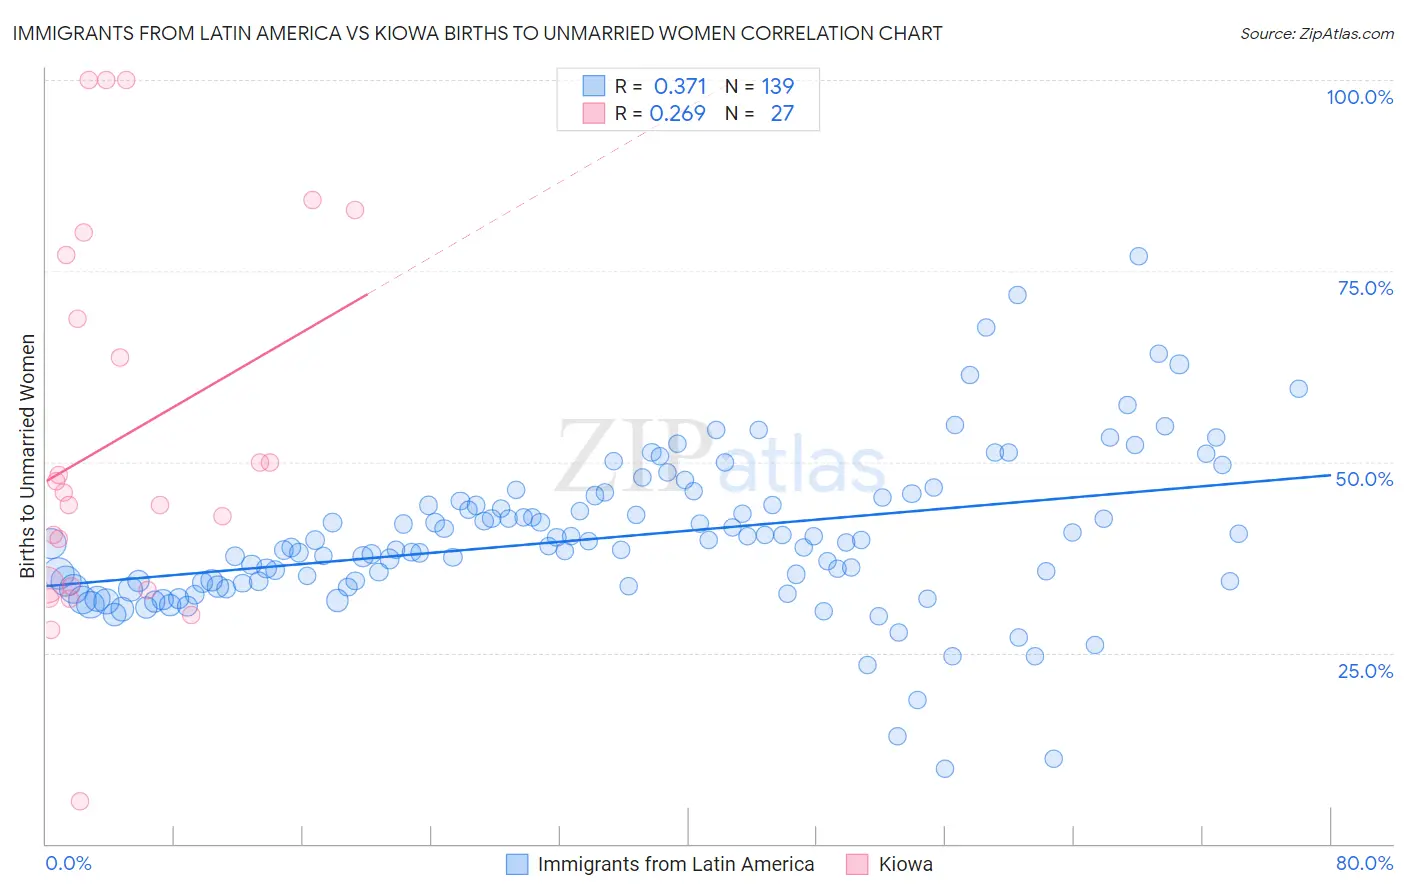
Immigrants from Latin America vs Kiowa Births to Unmarried Women Correlation Chart
The statistical analysis conducted on geographies consisting of 501,046,047 people shows a mild positive correlation between the proportion of Immigrants from Latin America and percentage of births to unmarried women in the United States with a correlation coefficient (R) of 0.371 and weighted average of 37.1%. Similarly, the statistical analysis conducted on geographies consisting of 55,598,383 people shows a weak positive correlation between the proportion of Kiowa and percentage of births to unmarried women in the United States with a correlation coefficient (R) of 0.269 and weighted average of 43.1%, a difference of 16.1%.
Births to Unmarried Women Correlation Summary
| Measurement | Immigrants from Latin America | Kiowa |
| Minimum | 9.8% | 5.6% |
| Maximum | 77.0% | 100.0% |
| Range | 67.2% | 94.4% |
| Mean | 40.1% | 53.3% |
| Median | 39.4% | 46.0% |
| Interquartile 25% (IQ1) | 34.1% | 33.8% |
| Interquartile 75% (IQ3) | 44.9% | 77.0% |
| Interquartile Range (IQR) | 10.7% | 43.2% |
| Standard Deviation (Sample) | 10.3% | 25.0% |
| Standard Deviation (Population) | 10.3% | 24.5% |
Similar Demographics by Births to Unmarried Women
Demographics Similar to Immigrants from Latin America by Births to Unmarried Women
In terms of births to unmarried women, the demographic groups most similar to Immigrants from Latin America are Guatemalan (37.1%, a difference of 0.090%), Belizean (37.0%, a difference of 0.30%), West Indian (37.3%, a difference of 0.33%), Immigrants from St. Vincent and the Grenadines (37.3%, a difference of 0.45%), and Immigrants from Belize (37.3%, a difference of 0.47%).
| Demographics | Rating | Rank | Births to Unmarried Women |
| Immigrants | Barbados | 0.1 /100 | #271 | Tragic 36.8% |
| Choctaw | 0.1 /100 | #272 | Tragic 36.9% |
| Mexicans | 0.1 /100 | #273 | Tragic 36.9% |
| Cree | 0.1 /100 | #274 | Tragic 37.0% |
| Barbadians | 0.1 /100 | #275 | Tragic 37.0% |
| Belizeans | 0.1 /100 | #276 | Tragic 37.0% |
| Guatemalans | 0.1 /100 | #277 | Tragic 37.1% |
| Immigrants | Latin America | 0.1 /100 | #278 | Tragic 37.1% |
| West Indians | 0.1 /100 | #279 | Tragic 37.3% |
| Immigrants | St. Vincent and the Grenadines | 0.1 /100 | #280 | Tragic 37.3% |
| Immigrants | Belize | 0.1 /100 | #281 | Tragic 37.3% |
| Liberians | 0.0 /100 | #282 | Tragic 37.4% |
| Spanish American Indians | 0.0 /100 | #283 | Tragic 37.4% |
| Immigrants | Central America | 0.0 /100 | #284 | Tragic 37.4% |
| Immigrants | Mexico | 0.0 /100 | #285 | Tragic 37.5% |
Demographics Similar to Kiowa by Births to Unmarried Women
In terms of births to unmarried women, the demographic groups most similar to Kiowa are Native/Alaskan (43.0%, a difference of 0.35%), Chippewa (42.6%, a difference of 1.2%), Paiute (42.5%, a difference of 1.6%), Immigrants from Cabo Verde (42.2%, a difference of 2.2%), and Tsimshian (42.2%, a difference of 2.3%).
| Demographics | Rating | Rank | Births to Unmarried Women |
| Cheyenne | 0.0 /100 | #325 | Tragic 41.3% |
| Immigrants | Cuba | 0.0 /100 | #326 | Tragic 41.5% |
| Tsimshian | 0.0 /100 | #327 | Tragic 42.2% |
| Immigrants | Cabo Verde | 0.0 /100 | #328 | Tragic 42.2% |
| Paiute | 0.0 /100 | #329 | Tragic 42.5% |
| Chippewa | 0.0 /100 | #330 | Tragic 42.6% |
| Natives/Alaskans | 0.0 /100 | #331 | Tragic 43.0% |
| Kiowa | 0.0 /100 | #332 | Tragic 43.1% |
| Blacks/African Americans | 0.0 /100 | #333 | Tragic 44.3% |
| Yuman | 0.0 /100 | #334 | Tragic 44.4% |
| Colville | 0.0 /100 | #335 | Tragic 45.3% |
| Puerto Ricans | 0.0 /100 | #336 | Tragic 45.7% |
| Houma | 0.0 /100 | #337 | Tragic 46.6% |
| Arapaho | 0.0 /100 | #338 | Tragic 47.1% |
| Lumbee | 0.0 /100 | #339 | Tragic 48.2% |