Immigrants from Jordan vs Kiowa College, Under 1 year
COMPARE
Immigrants from Jordan
Kiowa
College, Under 1 year
College, Under 1 year Comparison
Immigrants from Jordan
Kiowa
67.3%
COLLEGE, UNDER 1 YEAR
92.8/ 100
METRIC RATING
122nd/ 347
METRIC RANK
57.8%
COLLEGE, UNDER 1 YEAR
0.0/ 100
METRIC RATING
304th/ 347
METRIC RANK
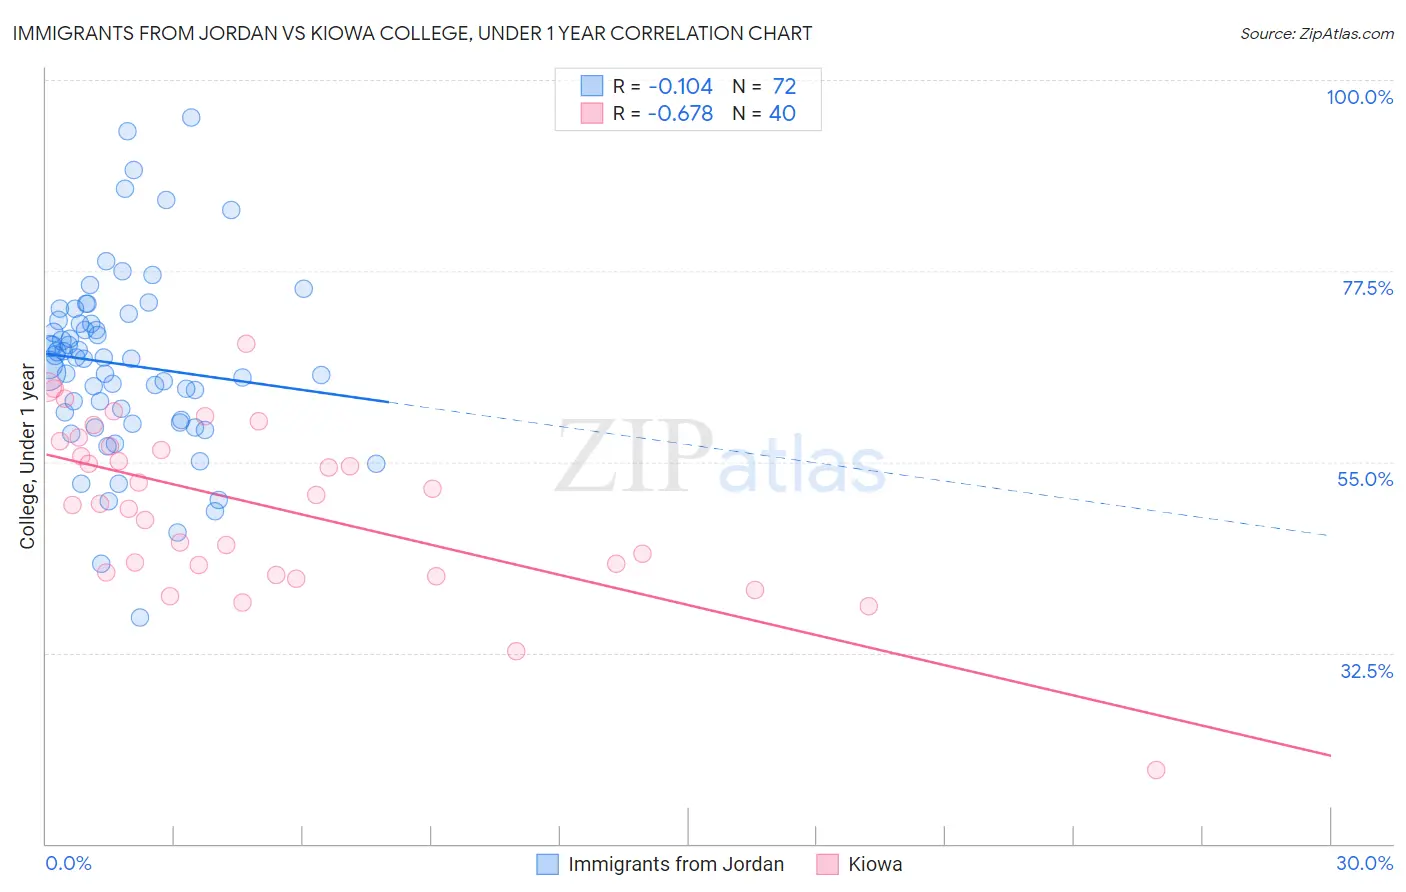
Immigrants from Jordan vs Kiowa College, Under 1 year Correlation Chart
The statistical analysis conducted on geographies consisting of 181,278,834 people shows a poor negative correlation between the proportion of Immigrants from Jordan and percentage of population with at least college, under 1 year education in the United States with a correlation coefficient (R) of -0.104 and weighted average of 67.3%. Similarly, the statistical analysis conducted on geographies consisting of 56,101,444 people shows a significant negative correlation between the proportion of Kiowa and percentage of population with at least college, under 1 year education in the United States with a correlation coefficient (R) of -0.678 and weighted average of 57.8%, a difference of 16.3%.
College, Under 1 year Correlation Summary
| Measurement | Immigrants from Jordan | Kiowa |
| Minimum | 36.7% | 18.8% |
| Maximum | 95.6% | 68.9% |
| Range | 59.0% | 50.2% |
| Mean | 66.5% | 49.8% |
| Median | 67.2% | 50.6% |
| Interquartile 25% (IQ1) | 59.8% | 42.4% |
| Interquartile 75% (IQ3) | 71.5% | 57.2% |
| Interquartile Range (IQR) | 11.7% | 14.8% |
| Standard Deviation (Sample) | 10.8% | 10.0% |
| Standard Deviation (Population) | 10.7% | 9.9% |
Similar Demographics by College, Under 1 year
Demographics Similar to Immigrants from Jordan by College, Under 1 year
In terms of college, under 1 year, the demographic groups most similar to Immigrants from Jordan are Immigrants from Northern Africa (67.2%, a difference of 0.020%), Arab (67.2%, a difference of 0.030%), Slovene (67.3%, a difference of 0.090%), Italian (67.2%, a difference of 0.15%), and Serbian (67.4%, a difference of 0.18%).
| Demographics | Rating | Rank | College, Under 1 year |
| Basques | 95.2 /100 | #115 | Exceptional 67.6% |
| Immigrants | Nepal | 94.9 /100 | #116 | Exceptional 67.5% |
| Pakistanis | 94.8 /100 | #117 | Exceptional 67.5% |
| Immigrants | Ukraine | 94.7 /100 | #118 | Exceptional 67.5% |
| Lebanese | 94.6 /100 | #119 | Exceptional 67.5% |
| Serbians | 93.9 /100 | #120 | Exceptional 67.4% |
| Slovenes | 93.3 /100 | #121 | Exceptional 67.3% |
| Immigrants | Jordan | 92.8 /100 | #122 | Exceptional 67.3% |
| Immigrants | Northern Africa | 92.7 /100 | #123 | Exceptional 67.2% |
| Arabs | 92.6 /100 | #124 | Exceptional 67.2% |
| Italians | 91.8 /100 | #125 | Exceptional 67.2% |
| Alsatians | 91.3 /100 | #126 | Exceptional 67.1% |
| Czechs | 90.8 /100 | #127 | Exceptional 67.1% |
| Scottish | 90.2 /100 | #128 | Exceptional 67.0% |
| Immigrants | Eastern Africa | 89.5 /100 | #129 | Excellent 67.0% |
Demographics Similar to Kiowa by College, Under 1 year
In terms of college, under 1 year, the demographic groups most similar to Kiowa are Immigrants from Dominica (57.9%, a difference of 0.010%), Haitian (57.8%, a difference of 0.11%), Apache (58.0%, a difference of 0.30%), Immigrants from Portugal (57.7%, a difference of 0.31%), and Fijian (57.7%, a difference of 0.32%).
| Demographics | Rating | Rank | College, Under 1 year |
| Guyanese | 0.0 /100 | #297 | Tragic 59.0% |
| Immigrants | Ecuador | 0.0 /100 | #298 | Tragic 58.7% |
| Cubans | 0.0 /100 | #299 | Tragic 58.6% |
| Immigrants | Guyana | 0.0 /100 | #300 | Tragic 58.5% |
| Mexican American Indians | 0.0 /100 | #301 | Tragic 58.1% |
| Apache | 0.0 /100 | #302 | Tragic 58.0% |
| Immigrants | Dominica | 0.0 /100 | #303 | Tragic 57.9% |
| Kiowa | 0.0 /100 | #304 | Tragic 57.8% |
| Haitians | 0.0 /100 | #305 | Tragic 57.8% |
| Immigrants | Portugal | 0.0 /100 | #306 | Tragic 57.7% |
| Fijians | 0.0 /100 | #307 | Tragic 57.7% |
| Central Americans | 0.0 /100 | #308 | Tragic 57.7% |
| Immigrants | Nicaragua | 0.0 /100 | #309 | Tragic 57.6% |
| Pueblo | 0.0 /100 | #310 | Tragic 57.4% |
| Cajuns | 0.0 /100 | #311 | Tragic 57.3% |