Immigrants from Kazakhstan vs Guamanian/Chamorro Single Mother Households
COMPARE
Immigrants from Kazakhstan
Guamanian/Chamorro
Single Mother Households
Single Mother Households Comparison
Immigrants from Kazakhstan
Guamanians/Chamorros
5.6%
SINGLE MOTHER HOUSEHOLDS
98.4/ 100
METRIC RATING
71st/ 347
METRIC RANK
6.6%
SINGLE MOTHER HOUSEHOLDS
12.4/ 100
METRIC RATING
202nd/ 347
METRIC RANK
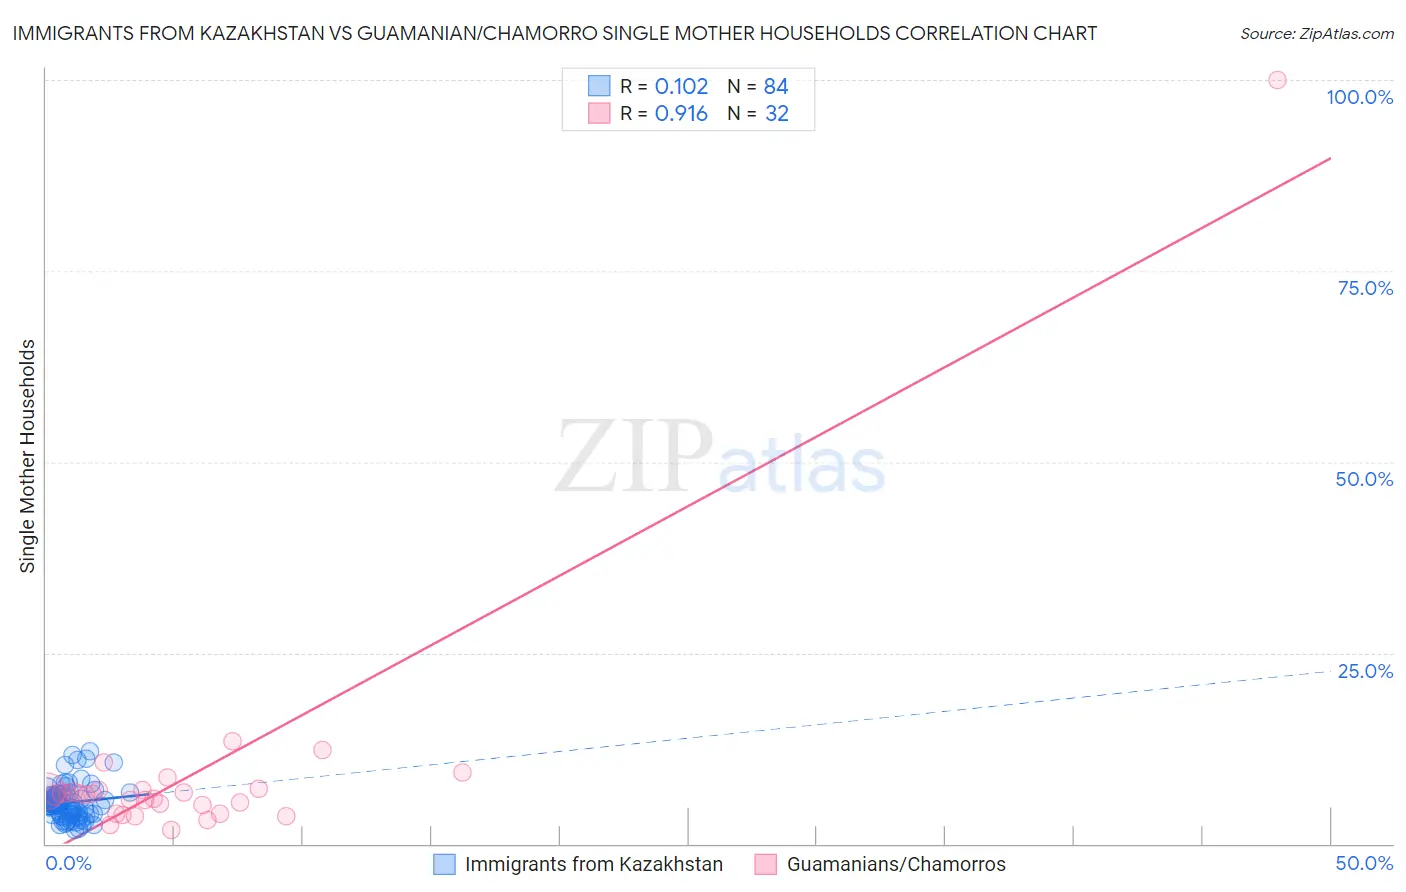
Immigrants from Kazakhstan vs Guamanian/Chamorro Single Mother Households Correlation Chart
The statistical analysis conducted on geographies consisting of 124,312,520 people shows a poor positive correlation between the proportion of Immigrants from Kazakhstan and percentage of single mother households in the United States with a correlation coefficient (R) of 0.102 and weighted average of 5.6%. Similarly, the statistical analysis conducted on geographies consisting of 221,648,092 people shows a near-perfect positive correlation between the proportion of Guamanians/Chamorros and percentage of single mother households in the United States with a correlation coefficient (R) of 0.916 and weighted average of 6.6%, a difference of 18.8%.
Single Mother Households Correlation Summary
| Measurement | Immigrants from Kazakhstan | Guamanian/Chamorro |
| Minimum | 1.8% | 1.8% |
| Maximum | 12.1% | 100.0% |
| Range | 10.3% | 98.2% |
| Mean | 5.4% | 9.2% |
| Median | 5.2% | 6.4% |
| Interquartile 25% (IQ1) | 3.8% | 4.5% |
| Interquartile 75% (IQ3) | 6.3% | 7.1% |
| Interquartile Range (IQR) | 2.5% | 2.5% |
| Standard Deviation (Sample) | 2.2% | 16.8% |
| Standard Deviation (Population) | 2.2% | 16.5% |
Similar Demographics by Single Mother Households
Demographics Similar to Immigrants from Kazakhstan by Single Mother Households
In terms of single mother households, the demographic groups most similar to Immigrants from Kazakhstan are Immigrants from Eastern Europe (5.6%, a difference of 0.010%), Asian (5.6%, a difference of 0.080%), Immigrants from Netherlands (5.6%, a difference of 0.090%), Immigrants from Bulgaria (5.6%, a difference of 0.11%), and Immigrants from Asia (5.6%, a difference of 0.15%).
| Demographics | Rating | Rank | Single Mother Households |
| Immigrants | France | 98.6 /100 | #64 | Exceptional 5.6% |
| Greeks | 98.6 /100 | #65 | Exceptional 5.6% |
| Immigrants | Canada | 98.5 /100 | #66 | Exceptional 5.6% |
| Italians | 98.5 /100 | #67 | Exceptional 5.6% |
| Immigrants | Bulgaria | 98.5 /100 | #68 | Exceptional 5.6% |
| Asians | 98.5 /100 | #69 | Exceptional 5.6% |
| Immigrants | Eastern Europe | 98.4 /100 | #70 | Exceptional 5.6% |
| Immigrants | Kazakhstan | 98.4 /100 | #71 | Exceptional 5.6% |
| Immigrants | Netherlands | 98.4 /100 | #72 | Exceptional 5.6% |
| Immigrants | Asia | 98.4 /100 | #73 | Exceptional 5.6% |
| Immigrants | North America | 98.3 /100 | #74 | Exceptional 5.6% |
| Slovenes | 98.3 /100 | #75 | Exceptional 5.6% |
| New Zealanders | 98.2 /100 | #76 | Exceptional 5.6% |
| Romanians | 98.1 /100 | #77 | Exceptional 5.6% |
| Swiss | 98.1 /100 | #78 | Exceptional 5.6% |
Demographics Similar to Guamanians/Chamorros by Single Mother Households
In terms of single mother households, the demographic groups most similar to Guamanians/Chamorros are Immigrants from Peru (6.7%, a difference of 0.090%), Immigrants from Fiji (6.7%, a difference of 0.11%), Venezuelan (6.6%, a difference of 0.12%), Cree (6.7%, a difference of 0.13%), and German Russian (6.7%, a difference of 0.21%).
| Demographics | Rating | Rank | Single Mother Households |
| South Americans | 18.0 /100 | #195 | Poor 6.6% |
| Uruguayans | 18.0 /100 | #196 | Poor 6.6% |
| Moroccans | 17.4 /100 | #197 | Poor 6.6% |
| Hawaiians | 16.1 /100 | #198 | Poor 6.6% |
| Potawatomi | 15.5 /100 | #199 | Poor 6.6% |
| Immigrants | Ethiopia | 14.7 /100 | #200 | Poor 6.6% |
| Venezuelans | 12.9 /100 | #201 | Poor 6.6% |
| Guamanians/Chamorros | 12.4 /100 | #202 | Poor 6.6% |
| Immigrants | Peru | 12.0 /100 | #203 | Poor 6.7% |
| Immigrants | Fiji | 11.9 /100 | #204 | Poor 6.7% |
| Cree | 11.9 /100 | #205 | Poor 6.7% |
| German Russians | 11.5 /100 | #206 | Poor 6.7% |
| Immigrants | South America | 11.5 /100 | #207 | Poor 6.7% |
| Vietnamese | 11.3 /100 | #208 | Poor 6.7% |
| Immigrants | Colombia | 10.5 /100 | #209 | Poor 6.7% |