Immigrants from Kazakhstan vs Pennsylvania German College, Under 1 year

COMPARE

Immigrants from Kazakhstan
Race
Ancestry
AfghanAfricanAlaska NativeAlaskan AthabascanAlbanianAleutAlsatianAmericanApacheArabArapahoArgentineanArmenianAssyrian/Chaldean/SyriacAustralianAustrianBahamianBangladeshiBarbadianBasqueBelgianBelizeanBermudanBhutaneseBlackfeetBolivianBrazilianBritishBritish West IndianBulgarianBurmeseCajunCambodianCanadianCape VerdeanCarpatho RusynCelticCentral AmericanCentral American IndianCherokeeCheyenneChickasawChileanChineseChippewaChoctawColombianColvilleComancheCosta RicanCreeCreekCroatianCrowCubanCypriotCzechCzechoslovakianDanishDelawareDominicanDutchDutch West IndianEastern EuropeanEcuadorianEgyptianEnglishEstonianEthiopianEuropeanFijianFilipinoFinnishFrenchFrench American IndianFrench CanadianGermanGerman RussianGhanaianGreekGuamanian/ChamorroGuatemalanGuyaneseHaitianHmongHonduranHopiHoumaHungarianIcelanderIndian (Asian)IndonesianInupiatIranianIraqiIrishIroquoisIsraeliItalianJamaicanJapaneseJordanianKenyanKiowaKoreanLaotianLatvianLebaneseLiberianLithuanianLumbeeLuxembourgerMacedonianMalaysianMalteseMarshalleseMenomineeMexicanMexican American IndianMongolianMoroccanNative HawaiianNavajoNepaleseNew ZealanderNicaraguanNigerianNorthern EuropeanNorwegianOkinawanOsageOttawaPaiutePakistaniPalestinianPanamanianParaguayanPeruvianPimaPolishPortuguesePotawatomiPuebloPuerto RicanPuget Sound SalishRomanianRussianSalvadoranSamoanScandinavianScotch-IrishScottishSeminoleSenegaleseSerbianShoshoneSierra LeoneanSiouxSlavicSlovakSloveneSomaliSouth AfricanSouth AmericanSouth American IndianSoviet UnionSpaniardSpanishSpanish AmericanSpanish American IndianSri LankanSubsaharan AfricanSudaneseSwedishSwissSyrianTaiwaneseThaiTlingit-HaidaTohono O'OdhamTonganTrinidadian and TobagonianTsimshianTurkishU.S. Virgin IslanderUgandanUkrainianUruguayanUteVenezuelanVietnameseWelshWest IndianYakamaYaquiYugoslavianYumanYup'ikZimbabwean
Immigration
NonimmigrantsImmigrantsAfghanistanAfricaAlbaniaArgentinaArmeniaAsiaAustraliaAustriaBahamasBangladeshBarbadosBelarusBelgiumBelizeBoliviaBosnia and HerzegovinaBrazilBulgariaBurma/MyanmarCabo VerdeCambodiaCameroonCanadaCaribbeanCentral AmericaChileChinaColombiaCongoCosta RicaCroatiaCubaCzechoslovakiaDenmarkDominicaDominican RepublicEastern AfricaEastern AsiaEastern EuropeEcuadorEgyptEl SalvadorEnglandEritreaEthiopiaEuropeFijiFranceGermanyGhanaGreeceGrenadaGuatemalaGuyanaHaitiHondurasHong KongHungaryIndiaIndonesiaIranIraqIrelandIsraelItalyJamaicaJapanJordanKazakhstanKenyaKoreaKuwaitLaosLatin AmericaLatviaLebanonLiberiaLithuaniaMalaysiaMexicoMicronesiaMiddle AfricaMoldovaMoroccoNepalNetherlandsNicaraguaNigeriaNorth AmericaNorth MacedoniaNorthern AfricaNorthern EuropeNorwayOceaniaPakistanPanamaPeruPhilippinesPolandPortugalRomaniaRussiaSaudi ArabiaScotlandSenegalSerbiaSierra LeoneSingaporeSomaliaSouth AfricaSouth AmericaSouth Central AsiaSouth Eastern AsiaSouthern EuropeSpainSri LankaSt. Vincent and the GrenadinesSudanSwedenSwitzerlandSyriaTaiwanThailandTrinidad and TobagoTurkeyUgandaUkraineUruguayUzbekistanVenezuelaVietnamWest IndiesWestern AfricaWestern AsiaWestern EuropeYemenZaireZimbabweAzores
Pennsylvania German
Race
Ancestry
AfghanAfricanAlaska NativeAlaskan AthabascanAlbanianAleutAlsatianAmericanApacheArabArapahoArgentineanArmenianAssyrian/Chaldean/SyriacAustralianAustrianBahamianBangladeshiBarbadianBasqueBelgianBelizeanBermudanBhutaneseBlackfeetBolivianBrazilianBritishBritish West IndianBulgarianBurmeseCajunCambodianCanadianCape VerdeanCarpatho RusynCelticCentral AmericanCentral American IndianCherokeeCheyenneChickasawChileanChineseChippewaChoctawColombianColvilleComancheCosta RicanCreeCreekCroatianCrowCubanCypriotCzechCzechoslovakianDanishDelawareDominicanDutchDutch West IndianEastern EuropeanEcuadorianEgyptianEnglishEstonianEthiopianEuropeanFijianFilipinoFinnishFrenchFrench American IndianFrench CanadianGermanGerman RussianGhanaianGreekGuamanian/ChamorroGuatemalanGuyaneseHaitianHmongHonduranHopiHoumaHungarianIcelanderIndian (Asian)IndonesianInupiatIranianIraqiIrishIroquoisIsraeliItalianJamaicanJapaneseJordanianKenyanKiowaKoreanLaotianLatvianLebaneseLiberianLithuanianLumbeeLuxembourgerMacedonianMalaysianMalteseMarshalleseMenomineeMexicanMexican American IndianMongolianMoroccanNative HawaiianNavajoNepaleseNew ZealanderNicaraguanNigerianNorthern EuropeanNorwegianOkinawanOsageOttawaPaiutePakistaniPalestinianPanamanianParaguayanPennsylvania GermanPeruvianPimaPolishPortuguesePotawatomiPuebloPuerto RicanPuget Sound SalishRomanianRussianSalvadoranSamoanScandinavianScotch-IrishScottishSeminoleSenegaleseSerbianShoshoneSierra LeoneanSiouxSlavicSlovakSloveneSomaliSouth AfricanSouth AmericanSouth American IndianSoviet UnionSpaniardSpanishSpanish AmericanSpanish American IndianSri LankanSubsaharan AfricanSudaneseSwedishSwissSyrianTaiwaneseThaiTlingit-HaidaTohono O'OdhamTonganTrinidadian and TobagonianTsimshianTurkishU.S. Virgin IslanderUgandanUkrainianUruguayanUteVenezuelanVietnameseWelshWest IndianYakamaYaquiYugoslavianYumanYup'ikZimbabwean
Immigration
NonimmigrantsImmigrantsAfghanistanAfricaAlbaniaArgentinaArmeniaAsiaAustraliaAustriaBahamasBangladeshBarbadosBelarusBelgiumBelizeBoliviaBosnia and HerzegovinaBrazilBulgariaBurma/MyanmarCabo VerdeCambodiaCameroonCanadaCaribbeanCentral AmericaChileChinaColombiaCongoCosta RicaCroatiaCubaCzechoslovakiaDenmarkDominicaDominican RepublicEastern AfricaEastern AsiaEastern EuropeEcuadorEgyptEl SalvadorEnglandEritreaEthiopiaEuropeFijiFranceGermanyGhanaGreeceGrenadaGuatemalaGuyanaHaitiHondurasHong KongHungaryIndiaIndonesiaIranIraqIrelandIsraelItalyJamaicaJapanJordanKenyaKoreaKuwaitLaosLatin AmericaLatviaLebanonLiberiaLithuaniaMalaysiaMexicoMicronesiaMiddle AfricaMoldovaMoroccoNepalNetherlandsNicaraguaNigeriaNorth AmericaNorth MacedoniaNorthern AfricaNorthern EuropeNorwayOceaniaPakistanPanamaPeruPhilippinesPolandPortugalRomaniaRussiaSaudi ArabiaScotlandSenegalSerbiaSierra LeoneSingaporeSomaliaSouth AfricaSouth AmericaSouth Central AsiaSouth Eastern AsiaSouthern EuropeSpainSri LankaSt. Vincent and the GrenadinesSudanSwedenSwitzerlandSyriaTaiwanThailandTrinidad and TobagoTurkeyUgandaUkraineUruguayUzbekistanVenezuelaVietnamWest IndiesWestern AfricaWestern AsiaWestern EuropeYemenZaireZimbabweAzores
College, Under 1 year
Income
Poverty
Unemployment
Labor Participation
Family Structure
Vehicle Availability
Education Level
Disability

College, Under 1 year Comparison

Immigrants from Kazakhstan

Pennsylvania Germans

Exceptional
Tragic
69.2%
COLLEGE, UNDER 1 YEAR
99.5/ 100
METRIC RATING
61st/ 347
METRIC RANK
54.5%
COLLEGE, UNDER 1 YEAR
0.0/ 100
METRIC RATING
336th/ 347
METRIC RANK

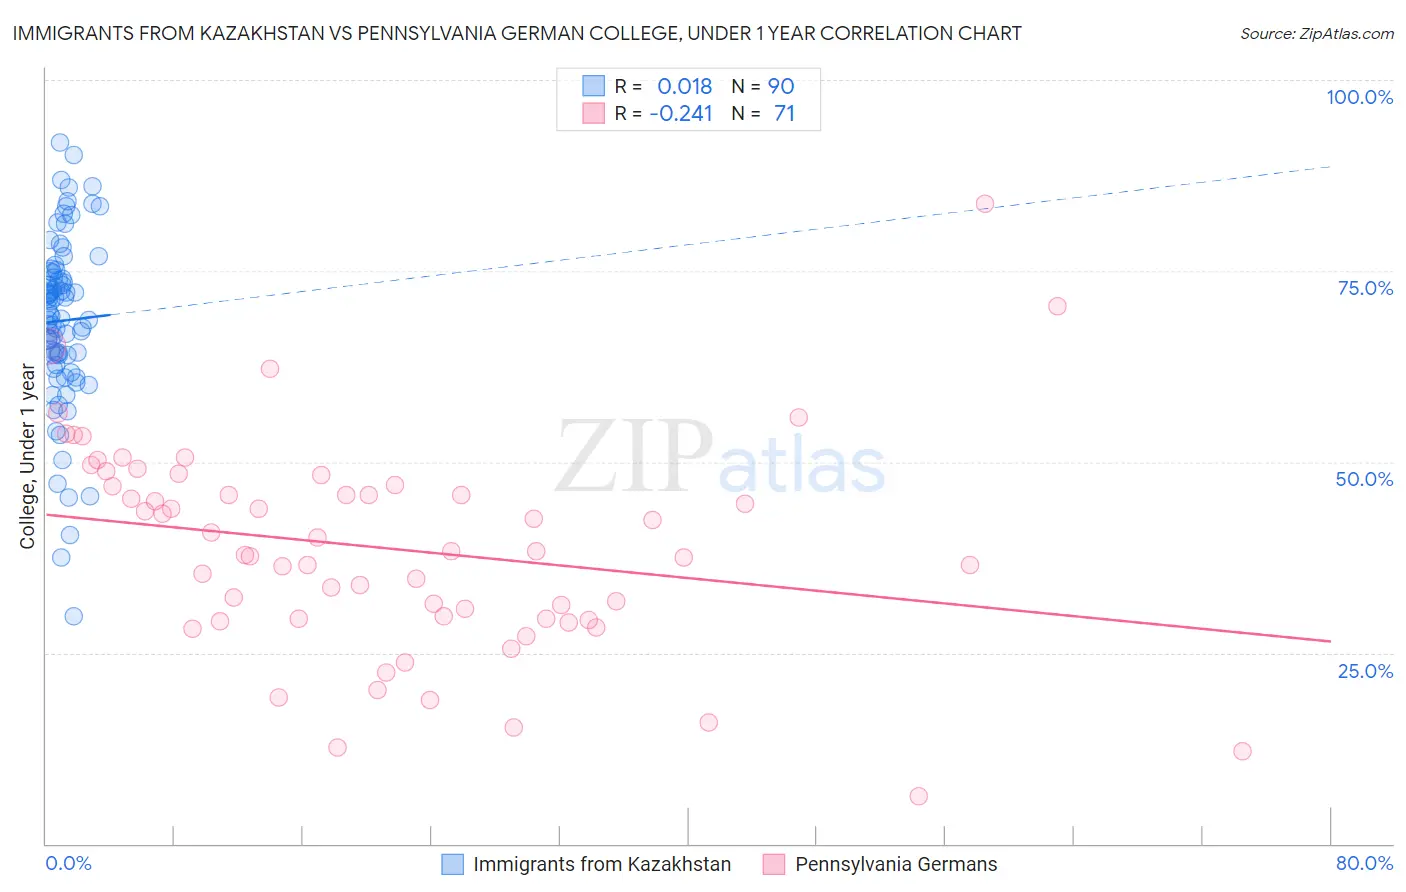
Immigrants from Kazakhstan vs Pennsylvania German College, Under 1 year Correlation Chart

The statistical analysis conducted on geographies consisting of 124,443,390 people shows no correlation between the proportion of Immigrants from Kazakhstan and percentage of population with at least college, under 1 year education in the United States with a correlation coefficient (R) of 0.018 and weighted average of 69.2%. Similarly, the statistical analysis conducted on geographies consisting of 234,102,446 people shows a weak negative correlation between the proportion of Pennsylvania Germans and percentage of population with at least college, under 1 year education in the United States with a correlation coefficient (R) of -0.241 and weighted average of 54.5%, a difference of 26.9%.
Immigrants from Kazakhstan vs Pennsylvania German College, Under 1 year

College, Under 1 year Correlation Summary

MeasurementImmigrants from KazakhstanPennsylvania German
Minimum29.7%6.2%
Maximum91.8%83.9%
Range62.1%77.6%
Mean68.5%38.7%
Median69.2%38.2%
Interquartile 25% (IQ1)63.9%29.4%
Interquartile 75% (IQ3)74.7%46.9%
Interquartile Range (IQR)10.8%17.5%
Standard Deviation (Sample)11.3%13.9%
Standard Deviation (Population)11.2%13.8%

Similar Demographics by College, Under 1 year

Demographics Similar to Immigrants from Kazakhstan by College, Under 1 year

In terms of college, under 1 year, the demographic groups most similar to Immigrants from Kazakhstan are Immigrants from Belarus (69.2%, a difference of 0.0%), Immigrants from Asia (69.2%, a difference of 0.040%), Immigrants from Serbia (69.3%, a difference of 0.13%), Immigrants from Canada (69.1%, a difference of 0.13%), and Northern European (69.0%, a difference of 0.17%).
DemographicsRating | RankCollege, Under 1 year
Immigrants | Czechoslovakia
99.7
/100
|
#54
Exceptional
69.6%
Maltese
99.7
/100
|
#55
Exceptional
69.5%
Immigrants | Scotland
99.6
/100
|
#56
Exceptional
69.4%
Asians
99.6
/100
|
#57
Exceptional
69.4%
Immigrants | Malaysia
99.6
/100
|
#58
Exceptional
69.3%
Immigrants | Serbia
99.5
/100
|
#59
Exceptional
69.3%
Immigrants | Asia
99.5
/100
|
#60
Exceptional
69.2%
Immigrants | Kazakhstan
99.5
/100
|
#61
Exceptional
69.2%
Immigrants | Belarus
99.5
/100
|
#62
Exceptional
69.2%
Immigrants | Canada
99.4
/100
|
#63
Exceptional
69.1%
Northern Europeans
99.4
/100
|
#64
Exceptional
69.0%
Immigrants | Moldova
99.3
/100
|
#65
Exceptional
69.0%
Immigrants | North America
99.3
/100
|
#66
Exceptional
69.0%
Immigrants | Zimbabwe
99.2
/100
|
#67
Exceptional
68.9%
Immigrants | Indonesia
99.2
/100
|
#68
Exceptional
68.9%

Demographics Similar to Pennsylvania Germans by College, Under 1 year

In terms of college, under 1 year, the demographic groups most similar to Pennsylvania Germans are Immigrants from Central America (54.4%, a difference of 0.15%), Inupiat (54.6%, a difference of 0.17%), Immigrants from the Azores (54.7%, a difference of 0.30%), Lumbee (54.2%, a difference of 0.56%), and Immigrants from Dominican Republic (54.0%, a difference of 0.96%).
DemographicsRating | RankCollege, Under 1 year
Immigrants | Cuba
0.0
/100
|
#329
Tragic
55.7%
Mexicans
0.0
/100
|
#330
Tragic
55.6%
Dominicans
0.0
/100
|
#331
Tragic
55.5%
Immigrants | Yemen
0.0
/100
|
#332
Tragic
55.3%
Yuman
0.0
/100
|
#333
Tragic
55.1%
Immigrants | Azores
0.0
/100
|
#334
Tragic
54.7%
Inupiat
0.0
/100
|
#335
Tragic
54.6%
Pennsylvania Germans
0.0
/100
|
#336
Tragic
54.5%
Immigrants | Central America
0.0
/100
|
#337
Tragic
54.4%
Lumbee
0.0
/100
|
#338
Tragic
54.2%
Immigrants | Dominican Republic
0.0
/100
|
#339
Tragic
54.0%
Spanish American Indians
0.0
/100
|
#340
Tragic
54.0%
Immigrants | Cabo Verde
0.0
/100
|
#341
Tragic
53.7%
Immigrants | Mexico
0.0
/100
|
#342
Tragic
53.7%
Tohono O'odham
0.0
/100
|
#343
Tragic
52.8%