Immigrants from Japan vs Cuban College, Under 1 year
COMPARE
Immigrants from Japan
Cuban
College, Under 1 year
College, Under 1 year Comparison
Immigrants from Japan
Cubans
71.9%
COLLEGE, UNDER 1 YEAR
100.0/ 100
METRIC RATING
16th/ 347
METRIC RANK
58.6%
COLLEGE, UNDER 1 YEAR
0.0/ 100
METRIC RATING
299th/ 347
METRIC RANK
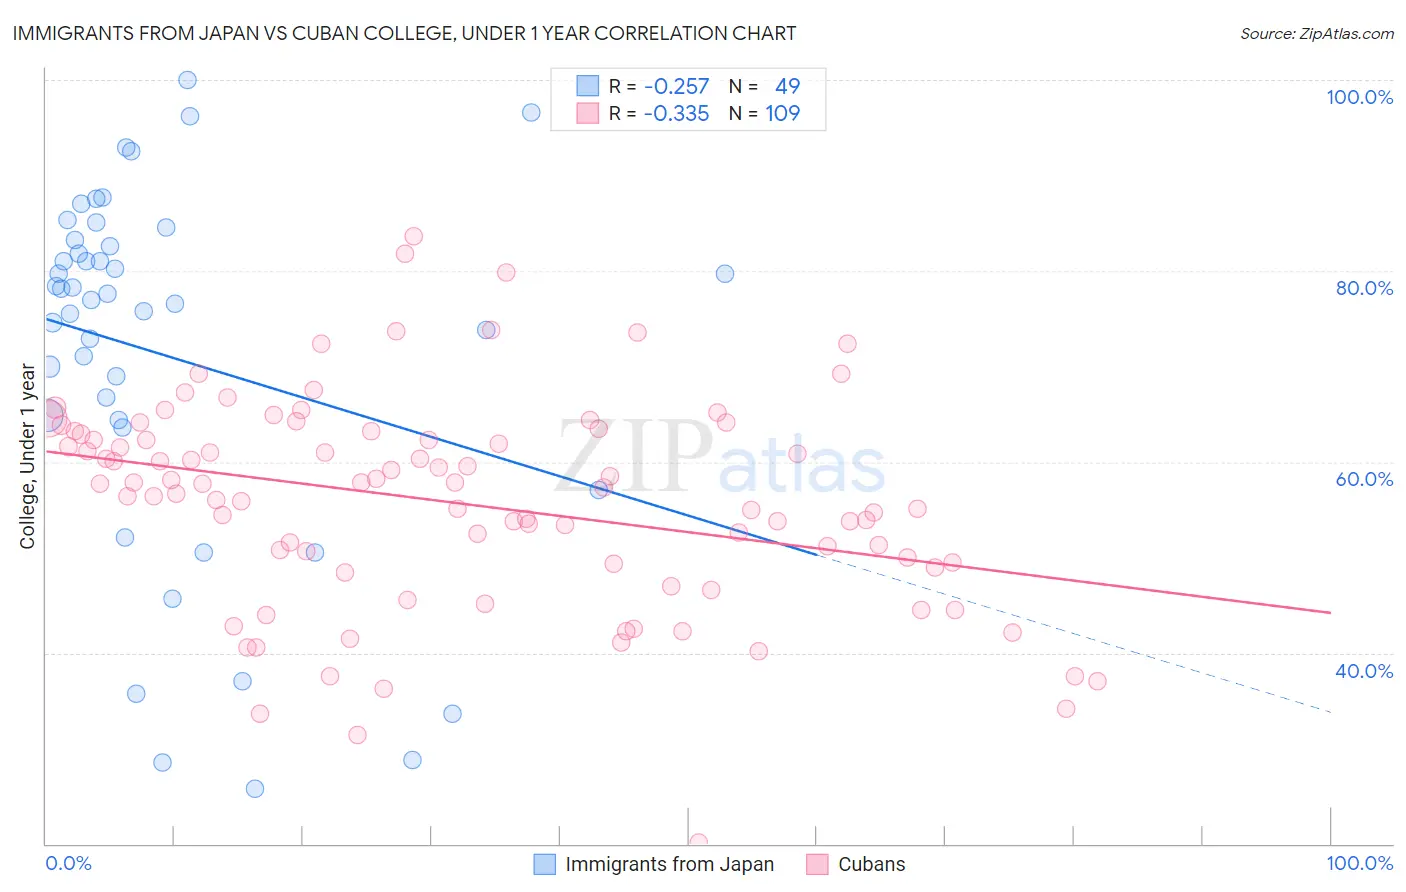
Immigrants from Japan vs Cuban College, Under 1 year Correlation Chart
The statistical analysis conducted on geographies consisting of 340,148,871 people shows a weak negative correlation between the proportion of Immigrants from Japan and percentage of population with at least college, under 1 year education in the United States with a correlation coefficient (R) of -0.257 and weighted average of 71.9%. Similarly, the statistical analysis conducted on geographies consisting of 449,373,028 people shows a mild negative correlation between the proportion of Cubans and percentage of population with at least college, under 1 year education in the United States with a correlation coefficient (R) of -0.335 and weighted average of 58.6%, a difference of 22.5%.
College, Under 1 year Correlation Summary
| Measurement | Immigrants from Japan | Cuban |
| Minimum | 25.7% | 20.1% |
| Maximum | 100.0% | 83.6% |
| Range | 74.3% | 63.5% |
| Mean | 71.0% | 55.7% |
| Median | 76.9% | 57.3% |
| Interquartile 25% (IQ1) | 64.0% | 49.1% |
| Interquartile 75% (IQ3) | 82.9% | 63.0% |
| Interquartile Range (IQR) | 19.0% | 13.9% |
| Standard Deviation (Sample) | 19.0% | 11.1% |
| Standard Deviation (Population) | 18.8% | 11.1% |
Similar Demographics by College, Under 1 year
Demographics Similar to Immigrants from Japan by College, Under 1 year
In terms of college, under 1 year, the demographic groups most similar to Immigrants from Japan are Cambodian (71.9%, a difference of 0.010%), Burmese (71.9%, a difference of 0.010%), Cypriot (72.0%, a difference of 0.13%), Eastern European (71.8%, a difference of 0.14%), and Immigrants from Switzerland (71.7%, a difference of 0.28%).
| Demographics | Rating | Rank | College, Under 1 year |
| Immigrants | Australia | 100.0 /100 | #9 | Exceptional 72.7% |
| Immigrants | Israel | 100.0 /100 | #10 | Exceptional 72.3% |
| Immigrants | South Central Asia | 100.0 /100 | #11 | Exceptional 72.1% |
| Immigrants | Sweden | 100.0 /100 | #12 | Exceptional 72.1% |
| Cypriots | 100.0 /100 | #13 | Exceptional 72.0% |
| Cambodians | 100.0 /100 | #14 | Exceptional 71.9% |
| Burmese | 100.0 /100 | #15 | Exceptional 71.9% |
| Immigrants | Japan | 100.0 /100 | #16 | Exceptional 71.9% |
| Eastern Europeans | 100.0 /100 | #17 | Exceptional 71.8% |
| Immigrants | Switzerland | 100.0 /100 | #18 | Exceptional 71.7% |
| Latvians | 100.0 /100 | #19 | Exceptional 71.6% |
| Immigrants | Korea | 100.0 /100 | #20 | Exceptional 71.6% |
| Immigrants | Belgium | 100.0 /100 | #21 | Exceptional 71.5% |
| Immigrants | Eastern Asia | 100.0 /100 | #22 | Exceptional 71.3% |
| Immigrants | Northern Europe | 100.0 /100 | #23 | Exceptional 71.1% |
Demographics Similar to Cubans by College, Under 1 year
In terms of college, under 1 year, the demographic groups most similar to Cubans are Immigrants from Ecuador (58.7%, a difference of 0.13%), Immigrants from Guyana (58.5%, a difference of 0.26%), Guyanese (59.0%, a difference of 0.63%), Central American Indian (59.0%, a difference of 0.68%), and Immigrants from Grenada (59.1%, a difference of 0.72%).
| Demographics | Rating | Rank | College, Under 1 year |
| Nicaraguans | 0.0 /100 | #292 | Tragic 59.2% |
| Seminole | 0.0 /100 | #293 | Tragic 59.1% |
| Immigrants | Belize | 0.0 /100 | #294 | Tragic 59.1% |
| Immigrants | Grenada | 0.0 /100 | #295 | Tragic 59.1% |
| Central American Indians | 0.0 /100 | #296 | Tragic 59.0% |
| Guyanese | 0.0 /100 | #297 | Tragic 59.0% |
| Immigrants | Ecuador | 0.0 /100 | #298 | Tragic 58.7% |
| Cubans | 0.0 /100 | #299 | Tragic 58.6% |
| Immigrants | Guyana | 0.0 /100 | #300 | Tragic 58.5% |
| Mexican American Indians | 0.0 /100 | #301 | Tragic 58.1% |
| Apache | 0.0 /100 | #302 | Tragic 58.0% |
| Immigrants | Dominica | 0.0 /100 | #303 | Tragic 57.9% |
| Kiowa | 0.0 /100 | #304 | Tragic 57.8% |
| Haitians | 0.0 /100 | #305 | Tragic 57.8% |
| Immigrants | Portugal | 0.0 /100 | #306 | Tragic 57.7% |