Maltese vs Japanese College, Under 1 year
COMPARE
Maltese
Japanese
College, Under 1 year
College, Under 1 year Comparison
Maltese
Japanese
69.5%
COLLEGE, UNDER 1 YEAR
99.7/ 100
METRIC RATING
55th/ 347
METRIC RANK
61.5%
COLLEGE, UNDER 1 YEAR
0.4/ 100
METRIC RATING
253rd/ 347
METRIC RANK
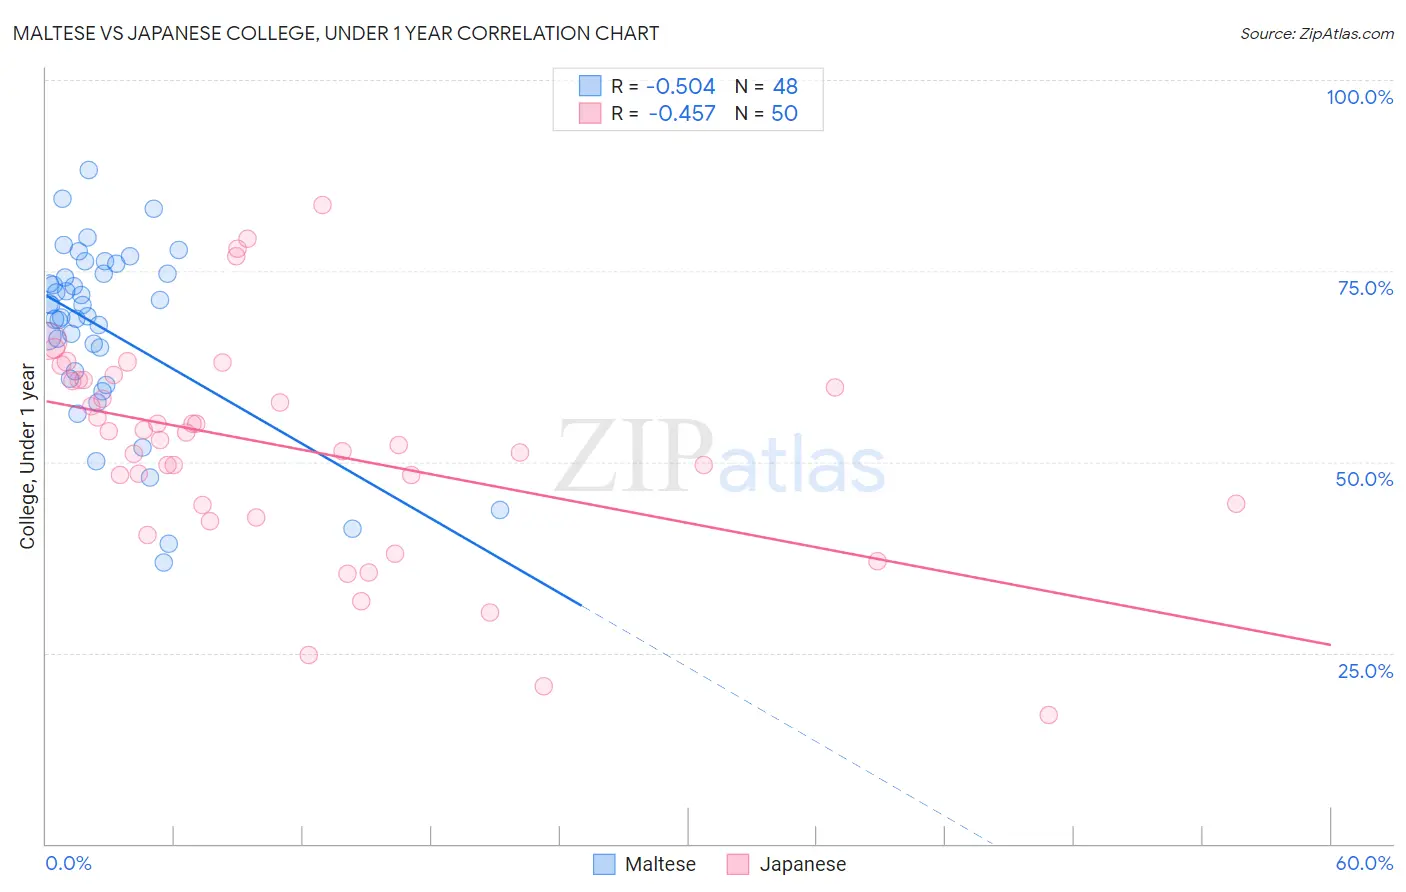
Maltese vs Japanese College, Under 1 year Correlation Chart
The statistical analysis conducted on geographies consisting of 126,478,070 people shows a substantial negative correlation between the proportion of Maltese and percentage of population with at least college, under 1 year education in the United States with a correlation coefficient (R) of -0.504 and weighted average of 69.5%. Similarly, the statistical analysis conducted on geographies consisting of 249,181,552 people shows a moderate negative correlation between the proportion of Japanese and percentage of population with at least college, under 1 year education in the United States with a correlation coefficient (R) of -0.457 and weighted average of 61.5%, a difference of 13.1%.
College, Under 1 year Correlation Summary
| Measurement | Maltese | Japanese |
| Minimum | 36.8% | 16.8% |
| Maximum | 88.3% | 83.7% |
| Range | 51.5% | 66.8% |
| Mean | 67.2% | 51.9% |
| Median | 69.8% | 53.4% |
| Interquartile 25% (IQ1) | 61.3% | 44.3% |
| Interquartile 75% (IQ3) | 74.7% | 60.8% |
| Interquartile Range (IQR) | 13.3% | 16.5% |
| Standard Deviation (Sample) | 11.7% | 14.1% |
| Standard Deviation (Population) | 11.6% | 13.9% |
Similar Demographics by College, Under 1 year
Demographics Similar to Maltese by College, Under 1 year
In terms of college, under 1 year, the demographic groups most similar to Maltese are Immigrants from Czechoslovakia (69.6%, a difference of 0.10%), Immigrants from Scotland (69.4%, a difference of 0.12%), Asian (69.4%, a difference of 0.14%), South African (69.7%, a difference of 0.22%), and Immigrants from Malaysia (69.3%, a difference of 0.24%).
| Demographics | Rating | Rank | College, Under 1 year |
| Immigrants | Netherlands | 99.8 /100 | #48 | Exceptional 70.0% |
| Immigrants | Austria | 99.8 /100 | #49 | Exceptional 70.0% |
| Zimbabweans | 99.8 /100 | #50 | Exceptional 69.9% |
| Mongolians | 99.8 /100 | #51 | Exceptional 69.9% |
| Immigrants | Russia | 99.8 /100 | #52 | Exceptional 69.9% |
| South Africans | 99.7 /100 | #53 | Exceptional 69.7% |
| Immigrants | Czechoslovakia | 99.7 /100 | #54 | Exceptional 69.6% |
| Maltese | 99.7 /100 | #55 | Exceptional 69.5% |
| Immigrants | Scotland | 99.6 /100 | #56 | Exceptional 69.4% |
| Asians | 99.6 /100 | #57 | Exceptional 69.4% |
| Immigrants | Malaysia | 99.6 /100 | #58 | Exceptional 69.3% |
| Immigrants | Serbia | 99.5 /100 | #59 | Exceptional 69.3% |
| Immigrants | Asia | 99.5 /100 | #60 | Exceptional 69.2% |
| Immigrants | Kazakhstan | 99.5 /100 | #61 | Exceptional 69.2% |
| Immigrants | Belarus | 99.5 /100 | #62 | Exceptional 69.2% |
Demographics Similar to Japanese by College, Under 1 year
In terms of college, under 1 year, the demographic groups most similar to Japanese are West Indian (61.5%, a difference of 0.0%), Immigrants from Cambodia (61.5%, a difference of 0.0%), Immigrants from Micronesia (61.5%, a difference of 0.11%), Comanche (61.4%, a difference of 0.13%), and Bangladeshi (61.4%, a difference of 0.17%).
| Demographics | Rating | Rank | College, Under 1 year |
| Marshallese | 0.8 /100 | #246 | Tragic 61.9% |
| Immigrants | Liberia | 0.8 /100 | #247 | Tragic 61.9% |
| Potawatomi | 0.6 /100 | #248 | Tragic 61.8% |
| Vietnamese | 0.5 /100 | #249 | Tragic 61.7% |
| Immigrants | Congo | 0.5 /100 | #250 | Tragic 61.7% |
| Immigrants | Micronesia | 0.5 /100 | #251 | Tragic 61.5% |
| West Indians | 0.4 /100 | #252 | Tragic 61.5% |
| Japanese | 0.4 /100 | #253 | Tragic 61.5% |
| Immigrants | Cambodia | 0.4 /100 | #254 | Tragic 61.5% |
| Comanche | 0.4 /100 | #255 | Tragic 61.4% |
| Bangladeshis | 0.4 /100 | #256 | Tragic 61.4% |
| Immigrants | Laos | 0.3 /100 | #257 | Tragic 61.3% |
| Immigrants | Bangladesh | 0.3 /100 | #258 | Tragic 61.3% |
| Indonesians | 0.3 /100 | #259 | Tragic 61.2% |
| Blackfeet | 0.3 /100 | #260 | Tragic 61.1% |