Immigrants from Jamaica vs Immigrants from Poland GED/Equivalency
COMPARE
Immigrants from Jamaica
Immigrants from Poland
GED/Equivalency
GED/Equivalency Comparison
Immigrants from Jamaica
Immigrants from Poland
82.9%
GED/EQUIVALENCY
0.2/ 100
METRIC RATING
270th/ 347
METRIC RANK
86.3%
GED/EQUIVALENCY
79.3/ 100
METRIC RATING
148th/ 347
METRIC RANK
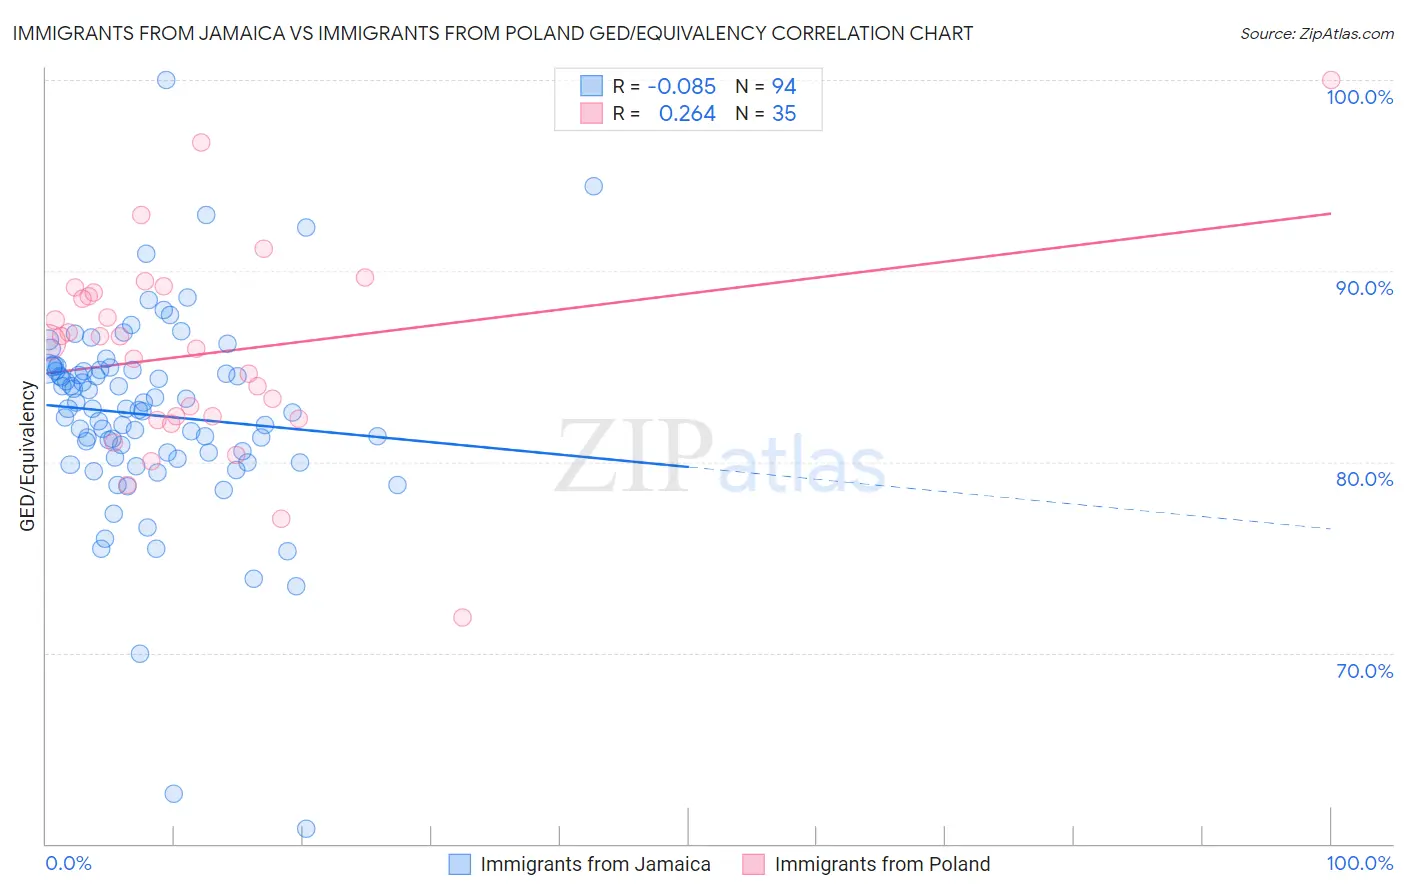
Immigrants from Jamaica vs Immigrants from Poland GED/Equivalency Correlation Chart
The statistical analysis conducted on geographies consisting of 301,829,399 people shows a slight negative correlation between the proportion of Immigrants from Jamaica and percentage of population with at least ged/equivalency education in the United States with a correlation coefficient (R) of -0.085 and weighted average of 82.9%. Similarly, the statistical analysis conducted on geographies consisting of 304,861,877 people shows a weak positive correlation between the proportion of Immigrants from Poland and percentage of population with at least ged/equivalency education in the United States with a correlation coefficient (R) of 0.264 and weighted average of 86.3%, a difference of 4.1%.
GED/Equivalency Correlation Summary
| Measurement | Immigrants from Jamaica | Immigrants from Poland |
| Minimum | 60.8% | 71.9% |
| Maximum | 100.0% | 100.0% |
| Range | 39.2% | 28.1% |
| Mean | 82.4% | 85.7% |
| Median | 82.8% | 86.2% |
| Interquartile 25% (IQ1) | 80.2% | 82.3% |
| Interquartile 75% (IQ3) | 84.8% | 88.9% |
| Interquartile Range (IQR) | 4.6% | 6.6% |
| Standard Deviation (Sample) | 5.4% | 5.4% |
| Standard Deviation (Population) | 5.3% | 5.3% |
Similar Demographics by GED/Equivalency
Demographics Similar to Immigrants from Jamaica by GED/Equivalency
In terms of ged/equivalency, the demographic groups most similar to Immigrants from Jamaica are U.S. Virgin Islander (82.9%, a difference of 0.040%), Hopi (83.0%, a difference of 0.050%), Barbadian (82.9%, a difference of 0.080%), Pennsylvania German (82.9%, a difference of 0.090%), and Immigrants from Burma/Myanmar (83.0%, a difference of 0.10%).
| Demographics | Rating | Rank | GED/Equivalency |
| Immigrants | Congo | 0.2 /100 | #263 | Tragic 83.1% |
| Bangladeshis | 0.2 /100 | #264 | Tragic 83.1% |
| West Indians | 0.2 /100 | #265 | Tragic 83.1% |
| Kiowa | 0.2 /100 | #266 | Tragic 83.1% |
| Trinidadians and Tobagonians | 0.2 /100 | #267 | Tragic 83.0% |
| Immigrants | Burma/Myanmar | 0.2 /100 | #268 | Tragic 83.0% |
| Hopi | 0.2 /100 | #269 | Tragic 83.0% |
| Immigrants | Jamaica | 0.2 /100 | #270 | Tragic 82.9% |
| U.S. Virgin Islanders | 0.2 /100 | #271 | Tragic 82.9% |
| Barbadians | 0.1 /100 | #272 | Tragic 82.9% |
| Pennsylvania Germans | 0.1 /100 | #273 | Tragic 82.9% |
| Immigrants | Trinidad and Tobago | 0.1 /100 | #274 | Tragic 82.8% |
| Seminole | 0.1 /100 | #275 | Tragic 82.8% |
| Blacks/African Americans | 0.1 /100 | #276 | Tragic 82.8% |
| Arapaho | 0.1 /100 | #277 | Tragic 82.8% |
Demographics Similar to Immigrants from Poland by GED/Equivalency
In terms of ged/equivalency, the demographic groups most similar to Immigrants from Poland are Basque (86.4%, a difference of 0.0%), Immigrants from Northern Africa (86.3%, a difference of 0.0%), Menominee (86.3%, a difference of 0.0%), Immigrants from Western Asia (86.3%, a difference of 0.020%), and Pakistani (86.4%, a difference of 0.030%).
| Demographics | Rating | Rank | GED/Equivalency |
| Laotians | 83.2 /100 | #141 | Excellent 86.5% |
| Immigrants | Indonesia | 82.4 /100 | #142 | Excellent 86.4% |
| Immigrants | Pakistan | 82.4 /100 | #143 | Excellent 86.4% |
| Bolivians | 82.1 /100 | #144 | Excellent 86.4% |
| Pakistanis | 80.4 /100 | #145 | Excellent 86.4% |
| Basques | 79.5 /100 | #146 | Good 86.4% |
| Immigrants | Northern Africa | 79.3 /100 | #147 | Good 86.3% |
| Immigrants | Poland | 79.3 /100 | #148 | Good 86.3% |
| Menominee | 79.3 /100 | #149 | Good 86.3% |
| Immigrants | Western Asia | 78.8 /100 | #150 | Good 86.3% |
| Immigrants | Bosnia and Herzegovina | 77.9 /100 | #151 | Good 86.3% |
| Brazilians | 77.2 /100 | #152 | Good 86.3% |
| Kenyans | 76.6 /100 | #153 | Good 86.3% |
| Armenians | 76.4 /100 | #154 | Good 86.3% |
| Iraqis | 75.2 /100 | #155 | Good 86.2% |