Immigrants from Iran vs Nonimmigrants Child Poverty Among Boys Under 16
COMPARE
Immigrants from Iran
Nonimmigrants
Child Poverty Among Boys Under 16
Child Poverty Among Boys Under 16 Comparison
Immigrants from Iran
Nonimmigrants
12.5%
CHILD POVERTY AMONG BOYS UNDER 16
100.0/ 100
METRIC RATING
9th/ 347
METRIC RANK
18.2%
CHILD POVERTY AMONG BOYS UNDER 16
2.2/ 100
METRIC RATING
228th/ 347
METRIC RANK
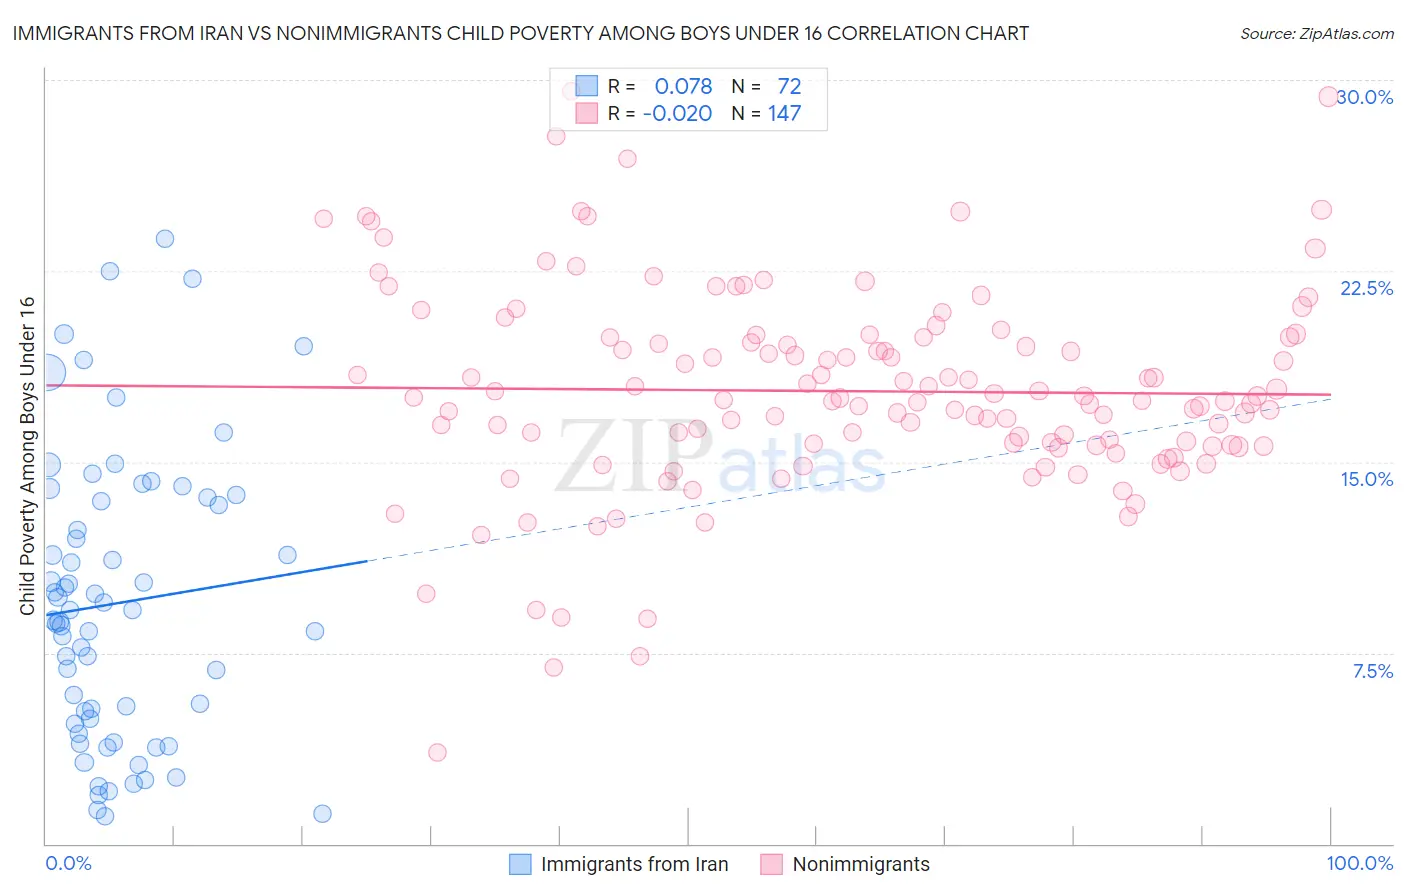
Immigrants from Iran vs Nonimmigrants Child Poverty Among Boys Under 16 Correlation Chart
The statistical analysis conducted on geographies consisting of 276,154,889 people shows a slight positive correlation between the proportion of Immigrants from Iran and poverty level among boys under the age of 16 in the United States with a correlation coefficient (R) of 0.078 and weighted average of 12.5%. Similarly, the statistical analysis conducted on geographies consisting of 561,195,614 people shows no correlation between the proportion of Nonimmigrants and poverty level among boys under the age of 16 in the United States with a correlation coefficient (R) of -0.020 and weighted average of 18.2%, a difference of 44.9%.
Child Poverty Among Boys Under 16 Correlation Summary
| Measurement | Immigrants from Iran | Nonimmigrants |
| Minimum | 1.1% | 3.6% |
| Maximum | 23.8% | 29.6% |
| Range | 22.7% | 26.0% |
| Mean | 9.5% | 17.8% |
| Median | 9.0% | 17.4% |
| Interquartile 25% (IQ1) | 4.8% | 15.7% |
| Interquartile 75% (IQ3) | 13.5% | 19.9% |
| Interquartile Range (IQR) | 8.7% | 4.2% |
| Standard Deviation (Sample) | 5.6% | 4.1% |
| Standard Deviation (Population) | 5.6% | 4.0% |
Similar Demographics by Child Poverty Among Boys Under 16
Demographics Similar to Immigrants from Iran by Child Poverty Among Boys Under 16
In terms of child poverty among boys under 16, the demographic groups most similar to Immigrants from Iran are Bhutanese (12.6%, a difference of 0.36%), Immigrants from Singapore (12.5%, a difference of 0.50%), Iranian (12.4%, a difference of 0.81%), Immigrants from South Central Asia (12.7%, a difference of 0.88%), and Immigrants from Hong Kong (12.3%, a difference of 2.4%).
| Demographics | Rating | Rank | Child Poverty Among Boys Under 16 |
| Immigrants | Taiwan | 100.0 /100 | #2 | Exceptional 11.0% |
| Filipinos | 100.0 /100 | #3 | Exceptional 11.1% |
| Thais | 100.0 /100 | #4 | Exceptional 11.7% |
| Chinese | 100.0 /100 | #5 | Exceptional 11.9% |
| Immigrants | Hong Kong | 100.0 /100 | #6 | Exceptional 12.3% |
| Iranians | 100.0 /100 | #7 | Exceptional 12.4% |
| Immigrants | Singapore | 100.0 /100 | #8 | Exceptional 12.5% |
| Immigrants | Iran | 100.0 /100 | #9 | Exceptional 12.5% |
| Bhutanese | 100.0 /100 | #10 | Exceptional 12.6% |
| Immigrants | South Central Asia | 100.0 /100 | #11 | Exceptional 12.7% |
| Burmese | 99.9 /100 | #12 | Exceptional 13.0% |
| Immigrants | Korea | 99.9 /100 | #13 | Exceptional 13.0% |
| Immigrants | Ireland | 99.9 /100 | #14 | Exceptional 13.1% |
| Immigrants | Japan | 99.9 /100 | #15 | Exceptional 13.1% |
| Maltese | 99.9 /100 | #16 | Exceptional 13.2% |
Demographics Similar to Nonimmigrants by Child Poverty Among Boys Under 16
In terms of child poverty among boys under 16, the demographic groups most similar to Nonimmigrants are Bermudan (18.1%, a difference of 0.33%), Immigrants from Africa (18.1%, a difference of 0.43%), Immigrants from Micronesia (18.3%, a difference of 0.52%), Fijian (18.3%, a difference of 0.52%), and Inupiat (18.1%, a difference of 0.59%).
| Demographics | Rating | Rank | Child Poverty Among Boys Under 16 |
| Immigrants | Panama | 4.3 /100 | #221 | Tragic 17.9% |
| Pennsylvania Germans | 3.9 /100 | #222 | Tragic 17.9% |
| Cubans | 3.8 /100 | #223 | Tragic 17.9% |
| Nepalese | 3.2 /100 | #224 | Tragic 18.0% |
| Inupiat | 2.7 /100 | #225 | Tragic 18.1% |
| Immigrants | Africa | 2.6 /100 | #226 | Tragic 18.1% |
| Bermudans | 2.5 /100 | #227 | Tragic 18.1% |
| Immigrants | Nonimmigrants | 2.2 /100 | #228 | Tragic 18.2% |
| Immigrants | Micronesia | 1.8 /100 | #229 | Tragic 18.3% |
| Fijians | 1.8 /100 | #230 | Tragic 18.3% |
| Nicaraguans | 1.4 /100 | #231 | Tragic 18.4% |
| Marshallese | 1.3 /100 | #232 | Tragic 18.4% |
| Immigrants | Nigeria | 1.2 /100 | #233 | Tragic 18.4% |
| Nigerians | 1.1 /100 | #234 | Tragic 18.5% |
| Americans | 0.9 /100 | #235 | Tragic 18.6% |