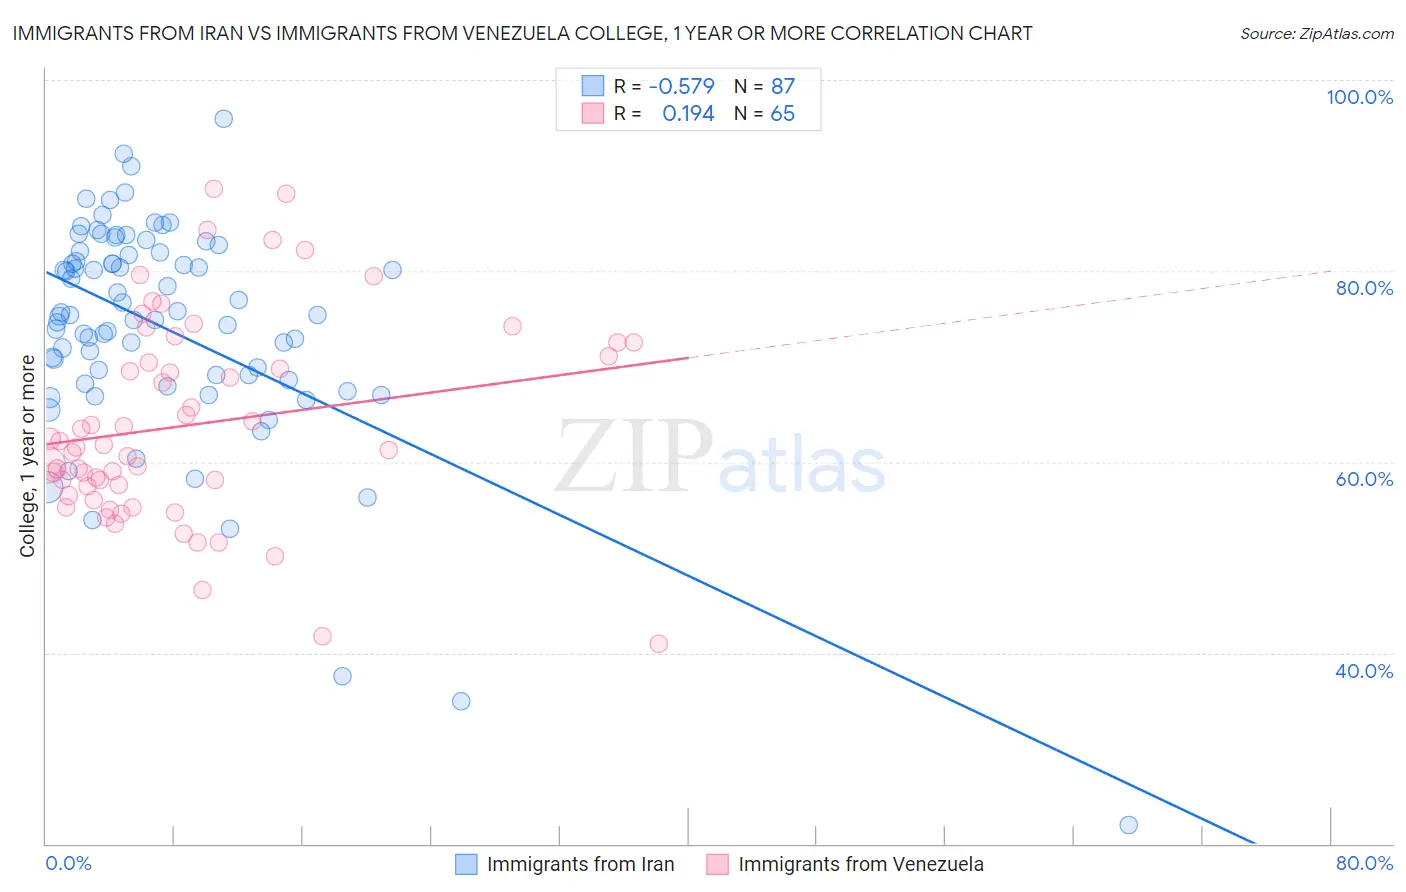
Immigrants from Iran vs Immigrants from Venezuela College, 1 year or more
COMPARE
Immigrants from Iran
Immigrants from Venezuela
College, 1 year or more
College, 1 year or more Comparison
Immigrants from Iran
Immigrants from Venezuela
69.5%
COLLEGE, 1 YEAR OR MORE
100.0/ 100
METRIC RATING
6th/ 347
METRIC RANK
61.0%
COLLEGE, 1 YEAR OR MORE
87.9/ 100
METRIC RATING
134th/ 347
METRIC RANK
Immigrants from Iran vs Immigrants from Venezuela College, 1 year or more Correlation Chart
The statistical analysis conducted on geographies consisting of 279,905,207 people shows a substantial negative correlation between the proportion of Immigrants from Iran and percentage of population with at least college, 1 year or more education in the United States with a correlation coefficient (R) of -0.579 and weighted average of 69.5%. Similarly, the statistical analysis conducted on geographies consisting of 287,865,065 people shows a poor positive correlation between the proportion of Immigrants from Venezuela and percentage of population with at least college, 1 year or more education in the United States with a correlation coefficient (R) of 0.194 and weighted average of 61.0%, a difference of 14.0%.
College, 1 year or more Correlation Summary
| Measurement | Immigrants from Iran | Immigrants from Venezuela |
| Minimum | 22.0% | 41.0% |
| Maximum | 96.0% | 88.6% |
| Range | 74.0% | 47.7% |
| Mean | 74.0% | 63.9% |
| Median | 75.3% | 61.5% |
| Interquartile 25% (IQ1) | 68.5% | 57.0% |
| Interquartile 75% (IQ3) | 82.0% | 71.8% |
| Interquartile Range (IQR) | 13.4% | 14.8% |
| Standard Deviation (Sample) | 12.0% | 10.6% |
| Standard Deviation (Population) | 11.9% | 10.5% |
Similar Demographics by College, 1 year or more
Demographics Similar to Immigrants from Iran by College, 1 year or more
In terms of college, 1 year or more, the demographic groups most similar to Immigrants from Iran are Immigrants from Taiwan (69.6%, a difference of 0.20%), Immigrants from India (69.6%, a difference of 0.20%), Iranian (70.0%, a difference of 0.70%), Okinawan (69.0%, a difference of 0.77%), and Immigrants from Singapore (70.1%, a difference of 0.92%).
| Demographics | Rating | Rank | College, 1 year or more |
| Filipinos | 100.0 /100 | #1 | Exceptional 71.0% |
| Immigrants | Singapore | 100.0 /100 | #2 | Exceptional 70.1% |
| Iranians | 100.0 /100 | #3 | Exceptional 70.0% |
| Immigrants | Taiwan | 100.0 /100 | #4 | Exceptional 69.6% |
| Immigrants | India | 100.0 /100 | #5 | Exceptional 69.6% |
| Immigrants | Iran | 100.0 /100 | #6 | Exceptional 69.5% |
| Okinawans | 100.0 /100 | #7 | Exceptional 69.0% |
| Thais | 100.0 /100 | #8 | Exceptional 68.6% |
| Immigrants | Israel | 100.0 /100 | #9 | Exceptional 67.8% |
| Immigrants | Australia | 100.0 /100 | #10 | Exceptional 67.7% |
| Immigrants | South Central Asia | 100.0 /100 | #11 | Exceptional 67.1% |
| Cypriots | 100.0 /100 | #12 | Exceptional 67.0% |
| Immigrants | Sweden | 100.0 /100 | #13 | Exceptional 66.8% |
| Burmese | 100.0 /100 | #14 | Exceptional 66.7% |
| Cambodians | 100.0 /100 | #15 | Exceptional 66.7% |
Demographics Similar to Immigrants from Venezuela by College, 1 year or more
In terms of college, 1 year or more, the demographic groups most similar to Immigrants from Venezuela are Immigrants from Uzbekistan (61.0%, a difference of 0.010%), Scandinavian (61.0%, a difference of 0.040%), Immigrants from Uganda (60.9%, a difference of 0.060%), Basque (60.9%, a difference of 0.080%), and Slovene (60.9%, a difference of 0.16%).
| Demographics | Rating | Rank | College, 1 year or more |
| Immigrants | Eastern Africa | 91.1 /100 | #127 | Exceptional 61.2% |
| Immigrants | Italy | 91.1 /100 | #128 | Exceptional 61.2% |
| Ugandans | 90.7 /100 | #129 | Exceptional 61.2% |
| Italians | 89.5 /100 | #130 | Excellent 61.1% |
| Immigrants | Morocco | 89.5 /100 | #131 | Excellent 61.1% |
| Scandinavians | 88.2 /100 | #132 | Excellent 61.0% |
| Immigrants | Uzbekistan | 88.0 /100 | #133 | Excellent 61.0% |
| Immigrants | Venezuela | 87.9 /100 | #134 | Excellent 61.0% |
| Immigrants | Uganda | 87.4 /100 | #135 | Excellent 60.9% |
| Basques | 87.2 /100 | #136 | Excellent 60.9% |
| Slovenes | 86.5 /100 | #137 | Excellent 60.9% |
| Taiwanese | 84.3 /100 | #138 | Excellent 60.7% |
| Immigrants | Eritrea | 84.3 /100 | #139 | Excellent 60.7% |
| Iraqis | 83.3 /100 | #140 | Excellent 60.7% |
| Immigrants | Afghanistan | 83.1 /100 | #141 | Excellent 60.7% |