Immigrants from Southern Europe vs Immigrants from Belarus Kindergarten
COMPARE
Immigrants from Southern Europe
Immigrants from Belarus
Kindergarten
Kindergarten Comparison
Immigrants from Southern Europe
Immigrants from Belarus
97.8%
KINDERGARTEN
18.0/ 100
METRIC RATING
205th/ 347
METRIC RANK
97.9%
KINDERGARTEN
39.4/ 100
METRIC RATING
185th/ 347
METRIC RANK
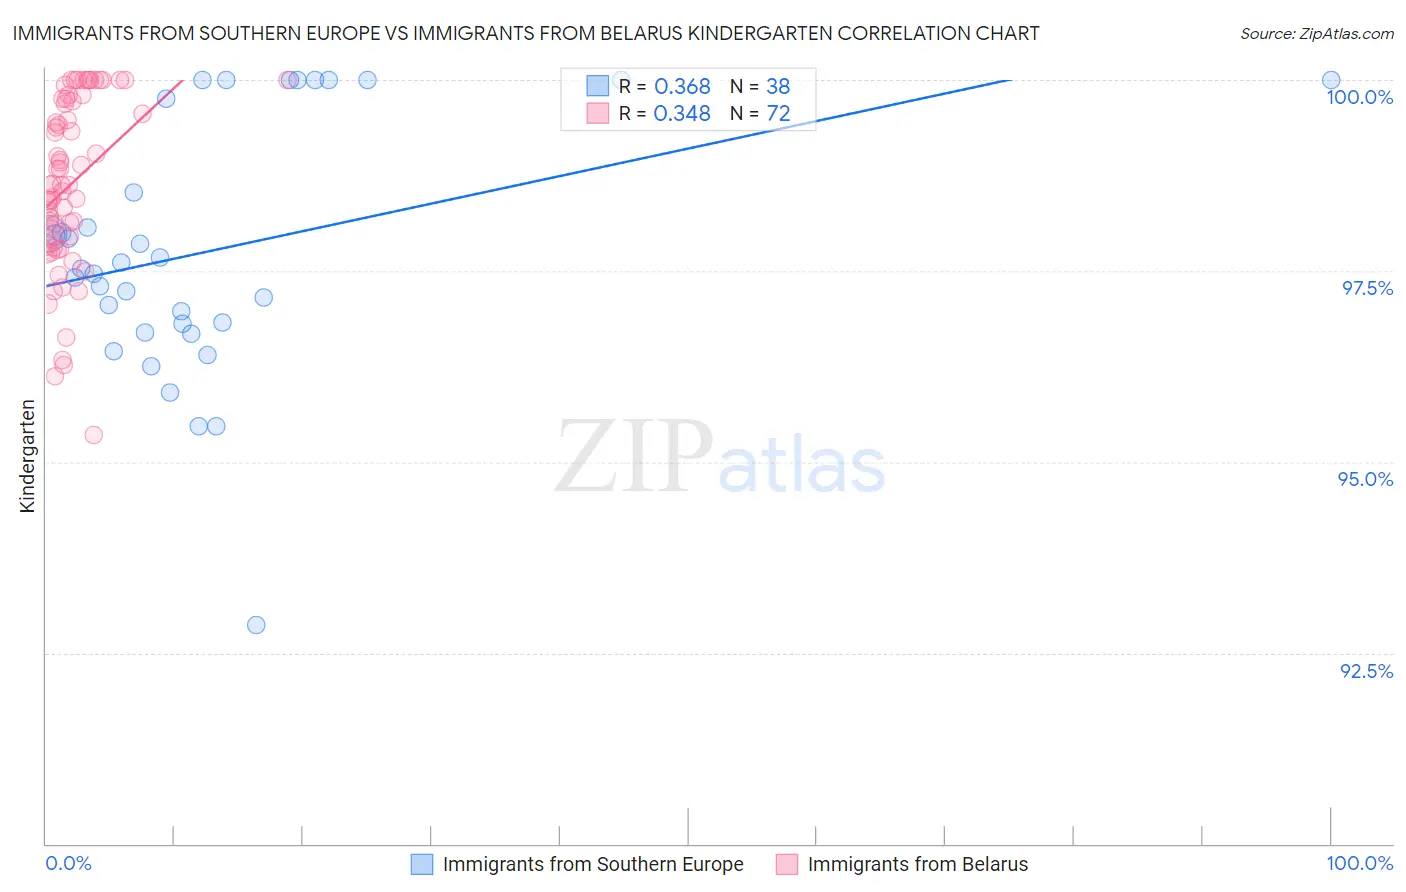
Immigrants from Southern Europe vs Immigrants from Belarus Kindergarten Correlation Chart
The statistical analysis conducted on geographies consisting of 402,804,595 people shows a mild positive correlation between the proportion of Immigrants from Southern Europe and percentage of population with at least kindergarten education in the United States with a correlation coefficient (R) of 0.368 and weighted average of 97.8%. Similarly, the statistical analysis conducted on geographies consisting of 149,993,317 people shows a mild positive correlation between the proportion of Immigrants from Belarus and percentage of population with at least kindergarten education in the United States with a correlation coefficient (R) of 0.348 and weighted average of 97.9%, a difference of 0.080%.
Kindergarten Correlation Summary
| Measurement | Immigrants from Southern Europe | Immigrants from Belarus |
| Minimum | 92.9% | 95.4% |
| Maximum | 100.0% | 100.0% |
| Range | 7.1% | 4.6% |
| Mean | 97.8% | 98.6% |
| Median | 97.6% | 98.6% |
| Interquartile 25% (IQ1) | 96.8% | 97.9% |
| Interquartile 75% (IQ3) | 99.8% | 99.7% |
| Interquartile Range (IQR) | 2.9% | 1.9% |
| Standard Deviation (Sample) | 1.6% | 1.1% |
| Standard Deviation (Population) | 1.6% | 1.1% |
Demographics Similar to Immigrants from Southern Europe and Immigrants from Belarus by Kindergarten
In terms of kindergarten, the demographic groups most similar to Immigrants from Southern Europe are Immigrants from Uganda (97.8%, a difference of 0.0%), Immigrants from Chile (97.8%, a difference of 0.0%), Immigrants from Lebanon (97.9%, a difference of 0.010%), Immigrants from Ukraine (97.8%, a difference of 0.010%), and Immigrants from Egypt (97.9%, a difference of 0.020%). Similarly, the demographic groups most similar to Immigrants from Belarus are Pakistani (97.9%, a difference of 0.010%), Immigrants from Kazakhstan (97.9%, a difference of 0.010%), Arab (97.9%, a difference of 0.010%), Paiute (97.9%, a difference of 0.020%), and Panamanian (97.9%, a difference of 0.020%).
| Demographics | Rating | Rank | Kindergarten |
| Immigrants | Belarus | 39.4 /100 | #185 | Fair 97.9% |
| Pakistanis | 36.0 /100 | #186 | Fair 97.9% |
| Immigrants | Kazakhstan | 35.9 /100 | #187 | Fair 97.9% |
| Arabs | 35.4 /100 | #188 | Fair 97.9% |
| Paiute | 34.7 /100 | #189 | Fair 97.9% |
| Panamanians | 33.3 /100 | #190 | Fair 97.9% |
| Immigrants | Taiwan | 30.7 /100 | #191 | Fair 97.9% |
| Blacks/African Americans | 29.9 /100 | #192 | Fair 97.9% |
| Paraguayans | 29.6 /100 | #193 | Fair 97.9% |
| Hawaiians | 29.3 /100 | #194 | Fair 97.9% |
| Mongolians | 28.9 /100 | #195 | Fair 97.9% |
| Guamanians/Chamorros | 26.2 /100 | #196 | Fair 97.9% |
| Immigrants | Kenya | 25.5 /100 | #197 | Fair 97.9% |
| Tohono O'odham | 24.6 /100 | #198 | Fair 97.9% |
| Immigrants | Egypt | 22.3 /100 | #199 | Fair 97.9% |
| Yuman | 21.6 /100 | #200 | Fair 97.9% |
| Immigrants | Lebanon | 20.9 /100 | #201 | Fair 97.9% |
| Immigrants | Ukraine | 19.1 /100 | #202 | Poor 97.8% |
| Immigrants | Uganda | 18.8 /100 | #203 | Poor 97.8% |
| Immigrants | Chile | 18.1 /100 | #204 | Poor 97.8% |
| Immigrants | Southern Europe | 18.0 /100 | #205 | Poor 97.8% |