Welsh vs Immigrants from Belarus Kindergarten
COMPARE
Welsh
Immigrants from Belarus
Kindergarten
Kindergarten Comparison
Welsh
Immigrants from Belarus
98.9%
KINDERGARTEN
100.0/ 100
METRIC RATING
4th/ 347
METRIC RANK
97.9%
KINDERGARTEN
39.4/ 100
METRIC RATING
185th/ 347
METRIC RANK
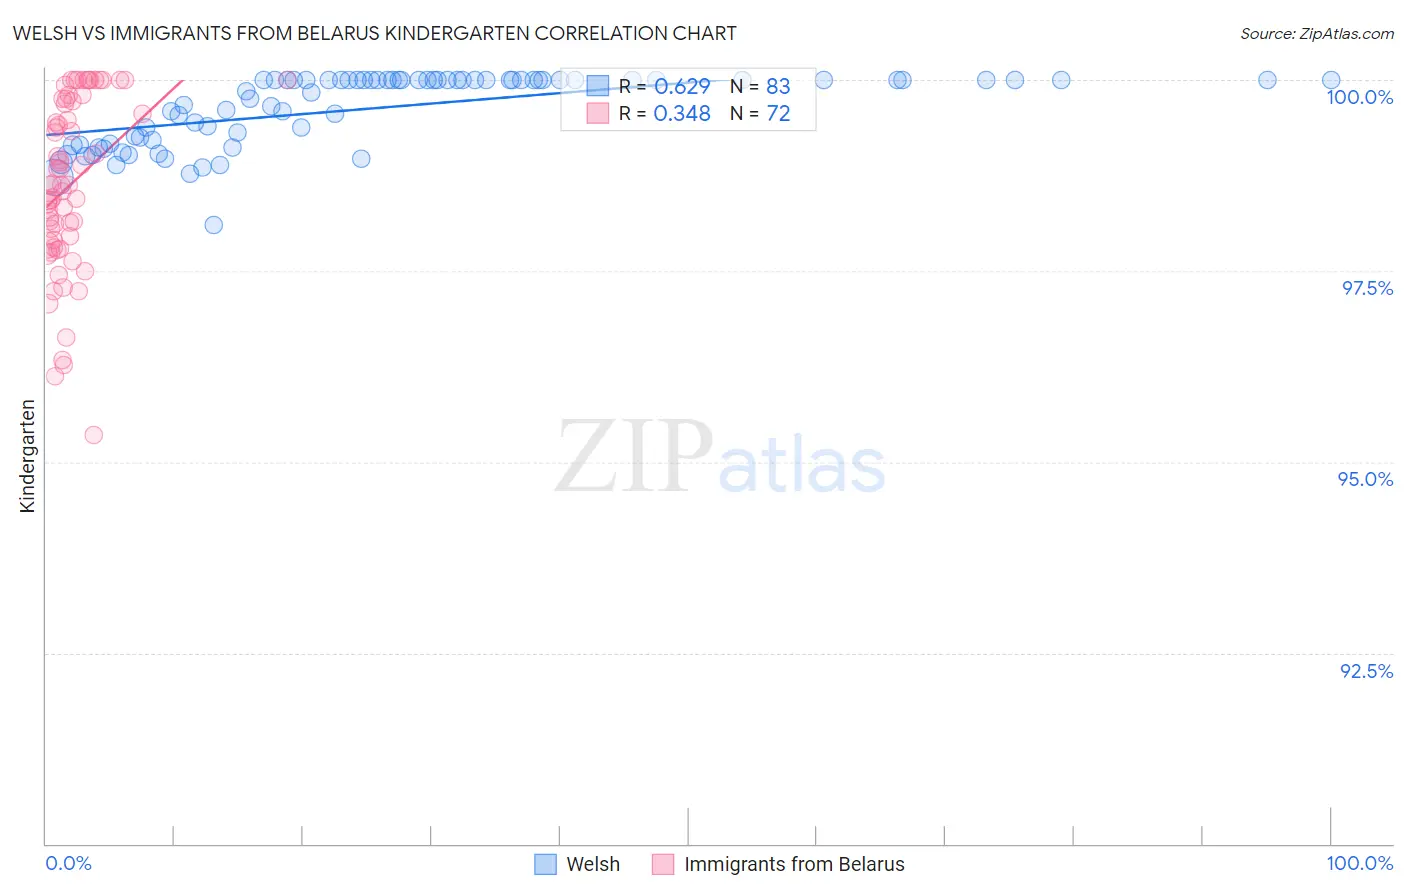
Welsh vs Immigrants from Belarus Kindergarten Correlation Chart
The statistical analysis conducted on geographies consisting of 239,962,401 people shows a significant positive correlation between the proportion of Welsh and percentage of population with at least kindergarten education in the United States with a correlation coefficient (R) of 0.629 and weighted average of 98.9%. Similarly, the statistical analysis conducted on geographies consisting of 149,993,317 people shows a mild positive correlation between the proportion of Immigrants from Belarus and percentage of population with at least kindergarten education in the United States with a correlation coefficient (R) of 0.348 and weighted average of 97.9%, a difference of 0.98%.
Kindergarten Correlation Summary
| Measurement | Welsh | Immigrants from Belarus |
| Minimum | 98.1% | 95.4% |
| Maximum | 100.0% | 100.0% |
| Range | 1.9% | 4.6% |
| Mean | 99.6% | 98.6% |
| Median | 100.0% | 98.6% |
| Interquartile 25% (IQ1) | 99.2% | 97.9% |
| Interquartile 75% (IQ3) | 100.0% | 99.7% |
| Interquartile Range (IQR) | 0.84% | 1.9% |
| Standard Deviation (Sample) | 0.46% | 1.1% |
| Standard Deviation (Population) | 0.46% | 1.1% |
Similar Demographics by Kindergarten
Demographics Similar to Welsh by Kindergarten
In terms of kindergarten, the demographic groups most similar to Welsh are Inupiat (98.9%, a difference of 0.010%), Tsimshian (98.8%, a difference of 0.020%), Alaskan Athabascan (98.8%, a difference of 0.090%), Alaska Native (98.7%, a difference of 0.13%), and Norwegian (98.7%, a difference of 0.15%).
| Demographics | Rating | Rank | Kindergarten |
| Crow | 100.0 /100 | #1 | Exceptional 99.7% |
| Yup'ik | 100.0 /100 | #2 | Exceptional 99.2% |
| Inupiat | 100.0 /100 | #3 | Exceptional 98.9% |
| Welsh | 100.0 /100 | #4 | Exceptional 98.9% |
| Tsimshian | 100.0 /100 | #5 | Exceptional 98.8% |
| Alaskan Athabascans | 100.0 /100 | #6 | Exceptional 98.8% |
| Alaska Natives | 100.0 /100 | #7 | Exceptional 98.7% |
| Norwegians | 100.0 /100 | #8 | Exceptional 98.7% |
| Tlingit-Haida | 100.0 /100 | #9 | Exceptional 98.7% |
| Slovaks | 100.0 /100 | #10 | Exceptional 98.7% |
| Germans | 100.0 /100 | #11 | Exceptional 98.7% |
| Slovenes | 100.0 /100 | #12 | Exceptional 98.7% |
| Carpatho Rusyns | 100.0 /100 | #13 | Exceptional 98.7% |
| English | 100.0 /100 | #14 | Exceptional 98.7% |
| Swedes | 100.0 /100 | #15 | Exceptional 98.7% |
Demographics Similar to Immigrants from Belarus by Kindergarten
In terms of kindergarten, the demographic groups most similar to Immigrants from Belarus are Immigrants from Argentina (97.9%, a difference of 0.0%), Portuguese (97.9%, a difference of 0.010%), Egyptian (97.9%, a difference of 0.010%), Immigrants from Poland (97.9%, a difference of 0.010%), and Pakistani (97.9%, a difference of 0.010%).
| Demographics | Rating | Rank | Kindergarten |
| Brazilians | 47.6 /100 | #178 | Average 97.9% |
| Argentineans | 46.8 /100 | #179 | Average 97.9% |
| Immigrants | Bosnia and Herzegovina | 46.7 /100 | #180 | Average 97.9% |
| Portuguese | 43.5 /100 | #181 | Average 97.9% |
| Egyptians | 42.4 /100 | #182 | Average 97.9% |
| Immigrants | Poland | 41.4 /100 | #183 | Average 97.9% |
| Immigrants | Argentina | 40.7 /100 | #184 | Average 97.9% |
| Immigrants | Belarus | 39.4 /100 | #185 | Fair 97.9% |
| Pakistanis | 36.0 /100 | #186 | Fair 97.9% |
| Immigrants | Kazakhstan | 35.9 /100 | #187 | Fair 97.9% |
| Arabs | 35.4 /100 | #188 | Fair 97.9% |
| Paiute | 34.7 /100 | #189 | Fair 97.9% |
| Panamanians | 33.3 /100 | #190 | Fair 97.9% |
| Immigrants | Taiwan | 30.7 /100 | #191 | Fair 97.9% |
| Blacks/African Americans | 29.9 /100 | #192 | Fair 97.9% |