Venezuelan vs Immigrants from Belarus Kindergarten
COMPARE
Venezuelan
Immigrants from Belarus
Kindergarten
Kindergarten Comparison
Venezuelans
Immigrants from Belarus
98.0%
KINDERGARTEN
64.7/ 100
METRIC RATING
158th/ 347
METRIC RANK
97.9%
KINDERGARTEN
39.4/ 100
METRIC RATING
185th/ 347
METRIC RANK
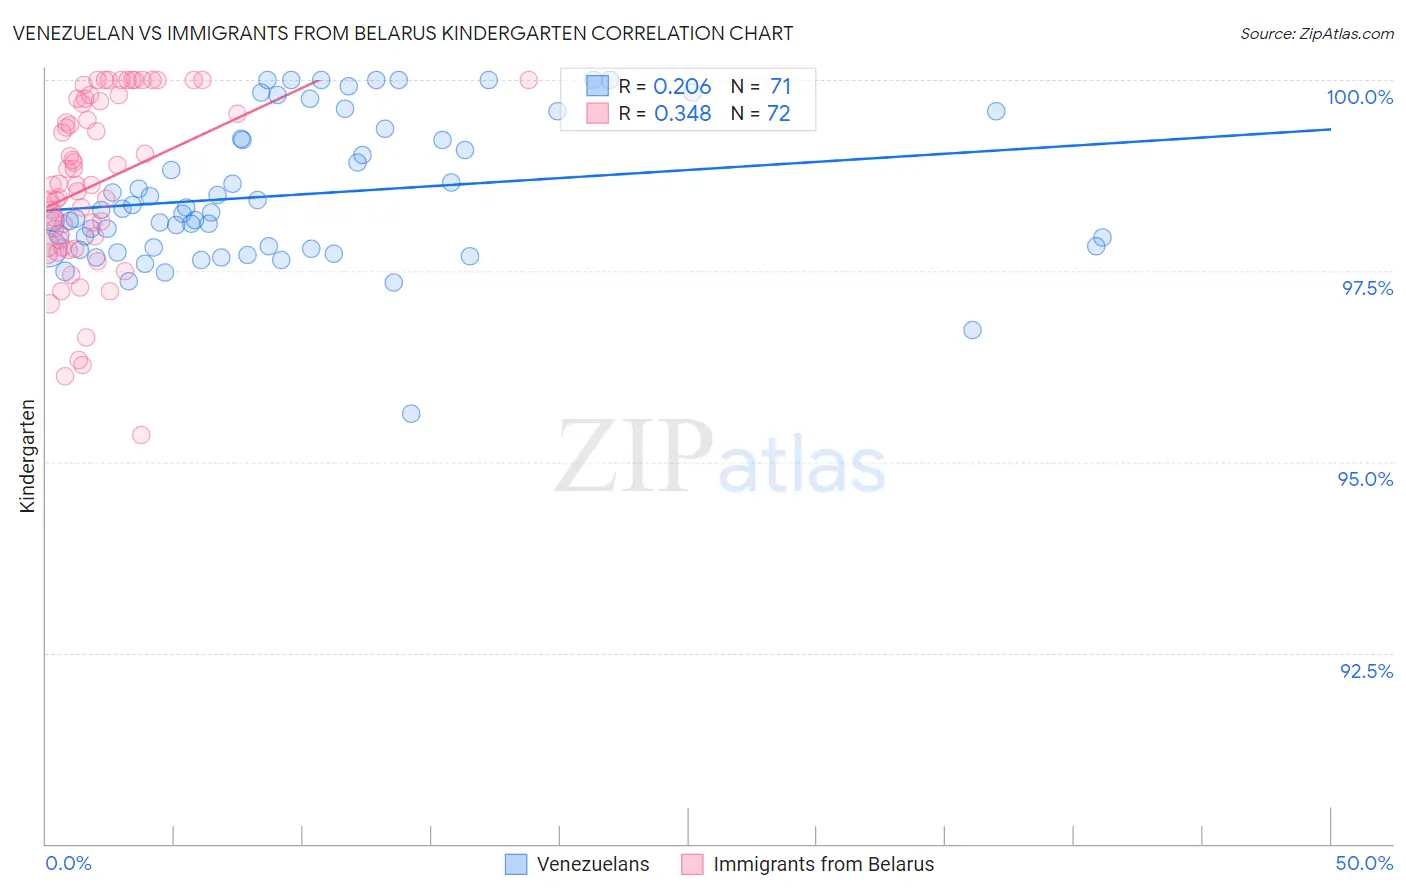
Venezuelan vs Immigrants from Belarus Kindergarten Correlation Chart
The statistical analysis conducted on geographies consisting of 306,323,638 people shows a weak positive correlation between the proportion of Venezuelans and percentage of population with at least kindergarten education in the United States with a correlation coefficient (R) of 0.206 and weighted average of 98.0%. Similarly, the statistical analysis conducted on geographies consisting of 149,993,317 people shows a mild positive correlation between the proportion of Immigrants from Belarus and percentage of population with at least kindergarten education in the United States with a correlation coefficient (R) of 0.348 and weighted average of 97.9%, a difference of 0.080%.
Kindergarten Correlation Summary
| Measurement | Venezuelan | Immigrants from Belarus |
| Minimum | 95.6% | 95.4% |
| Maximum | 100.0% | 100.0% |
| Range | 4.4% | 4.6% |
| Mean | 98.5% | 98.6% |
| Median | 98.3% | 98.6% |
| Interquartile 25% (IQ1) | 97.8% | 97.9% |
| Interquartile 75% (IQ3) | 99.2% | 99.7% |
| Interquartile Range (IQR) | 1.4% | 1.9% |
| Standard Deviation (Sample) | 0.94% | 1.1% |
| Standard Deviation (Population) | 0.93% | 1.1% |
Similar Demographics by Kindergarten
Demographics Similar to Venezuelans by Kindergarten
In terms of kindergarten, the demographic groups most similar to Venezuelans are French American Indian (98.0%, a difference of 0.0%), Immigrants from Iran (98.0%, a difference of 0.010%), Comanche (98.0%, a difference of 0.010%), Immigrants from South Central Asia (98.0%, a difference of 0.010%), and Immigrants from North Macedonia (98.0%, a difference of 0.010%).
| Demographics | Rating | Rank | Kindergarten |
| Soviet Union | 70.8 /100 | #151 | Good 98.0% |
| Dutch West Indians | 70.1 /100 | #152 | Good 98.0% |
| Immigrants | Moldova | 69.1 /100 | #153 | Good 98.0% |
| Immigrants | Iran | 68.8 /100 | #154 | Good 98.0% |
| Comanche | 68.3 /100 | #155 | Good 98.0% |
| Immigrants | South Central Asia | 66.6 /100 | #156 | Good 98.0% |
| Immigrants | North Macedonia | 66.4 /100 | #157 | Good 98.0% |
| Venezuelans | 64.7 /100 | #158 | Good 98.0% |
| French American Indians | 63.7 /100 | #159 | Good 98.0% |
| Immigrants | Russia | 59.0 /100 | #160 | Average 98.0% |
| Immigrants | Eastern Europe | 59.0 /100 | #161 | Average 98.0% |
| Immigrants | Italy | 58.9 /100 | #162 | Average 98.0% |
| Spanish Americans | 57.8 /100 | #163 | Average 98.0% |
| Immigrants | Micronesia | 57.7 /100 | #164 | Average 98.0% |
| Ugandans | 56.9 /100 | #165 | Average 98.0% |
Demographics Similar to Immigrants from Belarus by Kindergarten
In terms of kindergarten, the demographic groups most similar to Immigrants from Belarus are Immigrants from Argentina (97.9%, a difference of 0.0%), Portuguese (97.9%, a difference of 0.010%), Egyptian (97.9%, a difference of 0.010%), Immigrants from Poland (97.9%, a difference of 0.010%), and Pakistani (97.9%, a difference of 0.010%).
| Demographics | Rating | Rank | Kindergarten |
| Brazilians | 47.6 /100 | #178 | Average 97.9% |
| Argentineans | 46.8 /100 | #179 | Average 97.9% |
| Immigrants | Bosnia and Herzegovina | 46.7 /100 | #180 | Average 97.9% |
| Portuguese | 43.5 /100 | #181 | Average 97.9% |
| Egyptians | 42.4 /100 | #182 | Average 97.9% |
| Immigrants | Poland | 41.4 /100 | #183 | Average 97.9% |
| Immigrants | Argentina | 40.7 /100 | #184 | Average 97.9% |
| Immigrants | Belarus | 39.4 /100 | #185 | Fair 97.9% |
| Pakistanis | 36.0 /100 | #186 | Fair 97.9% |
| Immigrants | Kazakhstan | 35.9 /100 | #187 | Fair 97.9% |
| Arabs | 35.4 /100 | #188 | Fair 97.9% |
| Paiute | 34.7 /100 | #189 | Fair 97.9% |
| Panamanians | 33.3 /100 | #190 | Fair 97.9% |
| Immigrants | Taiwan | 30.7 /100 | #191 | Fair 97.9% |
| Blacks/African Americans | 29.9 /100 | #192 | Fair 97.9% |