Immigrants from Grenada vs Yaqui 12th Grade, No Diploma
COMPARE
Immigrants from Grenada
Yaqui
12th Grade, No Diploma
12th Grade, No Diploma Comparison
Immigrants from Grenada
Yaqui
88.4%
12TH GRADE, NO DIPLOMA
0.0/ 100
METRIC RATING
292nd/ 347
METRIC RANK
87.5%
12TH GRADE, NO DIPLOMA
0.0/ 100
METRIC RATING
311th/ 347
METRIC RANK
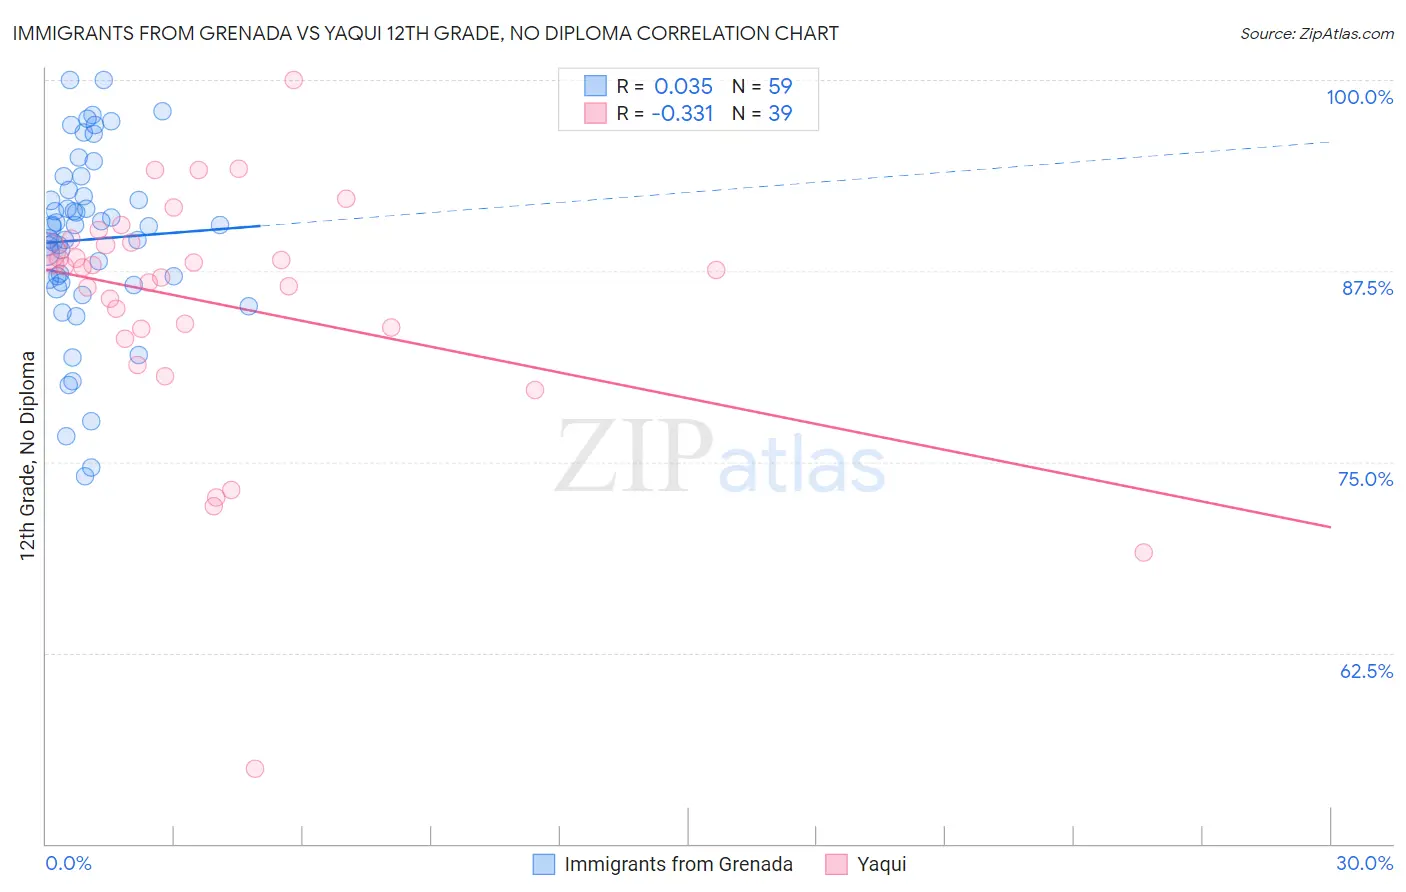
Immigrants from Grenada vs Yaqui 12th Grade, No Diploma Correlation Chart
The statistical analysis conducted on geographies consisting of 67,201,908 people shows no correlation between the proportion of Immigrants from Grenada and percentage of population with at least 12th grade (no diploma) education in the United States with a correlation coefficient (R) of 0.035 and weighted average of 88.4%. Similarly, the statistical analysis conducted on geographies consisting of 107,725,021 people shows a mild negative correlation between the proportion of Yaqui and percentage of population with at least 12th grade (no diploma) education in the United States with a correlation coefficient (R) of -0.331 and weighted average of 87.5%, a difference of 1.0%.
12th Grade, No Diploma Correlation Summary
| Measurement | Immigrants from Grenada | Yaqui |
| Minimum | 74.0% | 54.9% |
| Maximum | 100.0% | 100.0% |
| Range | 26.0% | 45.1% |
| Mean | 89.6% | 85.4% |
| Median | 90.4% | 87.8% |
| Interquartile 25% (IQ1) | 86.7% | 83.7% |
| Interquartile 75% (IQ3) | 92.8% | 89.4% |
| Interquartile Range (IQR) | 6.0% | 5.7% |
| Standard Deviation (Sample) | 5.9% | 8.1% |
| Standard Deviation (Population) | 5.9% | 8.0% |
Demographics Similar to Immigrants from Grenada and Yaqui by 12th Grade, No Diploma
In terms of 12th grade, no diploma, the demographic groups most similar to Immigrants from Grenada are Japanese (88.3%, a difference of 0.090%), Guyanese (88.3%, a difference of 0.15%), Haitian (88.5%, a difference of 0.17%), Immigrants (88.2%, a difference of 0.19%), and Fijian (88.2%, a difference of 0.22%). Similarly, the demographic groups most similar to Yaqui are Immigrants from Cuba (87.5%, a difference of 0.040%), Immigrants from Armenia (87.6%, a difference of 0.090%), Yup'ik (87.6%, a difference of 0.12%), Immigrants from Portugal (87.6%, a difference of 0.16%), and Native/Alaskan (87.7%, a difference of 0.20%).
| Demographics | Rating | Rank | 12th Grade, No Diploma |
| Haitians | 0.0 /100 | #291 | Tragic 88.5% |
| Immigrants | Grenada | 0.0 /100 | #292 | Tragic 88.4% |
| Japanese | 0.0 /100 | #293 | Tragic 88.3% |
| Guyanese | 0.0 /100 | #294 | Tragic 88.3% |
| Immigrants | Immigrants | 0.0 /100 | #295 | Tragic 88.2% |
| Fijians | 0.0 /100 | #296 | Tragic 88.2% |
| Pueblo | 0.0 /100 | #297 | Tragic 88.2% |
| Immigrants | Haiti | 0.0 /100 | #298 | Tragic 88.2% |
| Nepalese | 0.0 /100 | #299 | Tragic 88.1% |
| Immigrants | Guyana | 0.0 /100 | #300 | Tragic 88.1% |
| Immigrants | Cambodia | 0.0 /100 | #301 | Tragic 88.1% |
| Ecuadorians | 0.0 /100 | #302 | Tragic 88.0% |
| Immigrants | Bangladesh | 0.0 /100 | #303 | Tragic 88.0% |
| Vietnamese | 0.0 /100 | #304 | Tragic 87.9% |
| Immigrants | Dominica | 0.0 /100 | #305 | Tragic 87.7% |
| Natives/Alaskans | 0.0 /100 | #306 | Tragic 87.7% |
| Immigrants | Portugal | 0.0 /100 | #307 | Tragic 87.6% |
| Yup'ik | 0.0 /100 | #308 | Tragic 87.6% |
| Immigrants | Armenia | 0.0 /100 | #309 | Tragic 87.6% |
| Immigrants | Cuba | 0.0 /100 | #310 | Tragic 87.5% |
| Yaqui | 0.0 /100 | #311 | Tragic 87.5% |