Immigrants from Ghana vs Italian College, Under 1 year
COMPARE
Immigrants from Ghana
Italian
College, Under 1 year
College, Under 1 year Comparison
Immigrants from Ghana
Italians
63.1%
COLLEGE, UNDER 1 YEAR
3.7/ 100
METRIC RATING
227th/ 347
METRIC RANK
67.2%
COLLEGE, UNDER 1 YEAR
91.8/ 100
METRIC RATING
125th/ 347
METRIC RANK
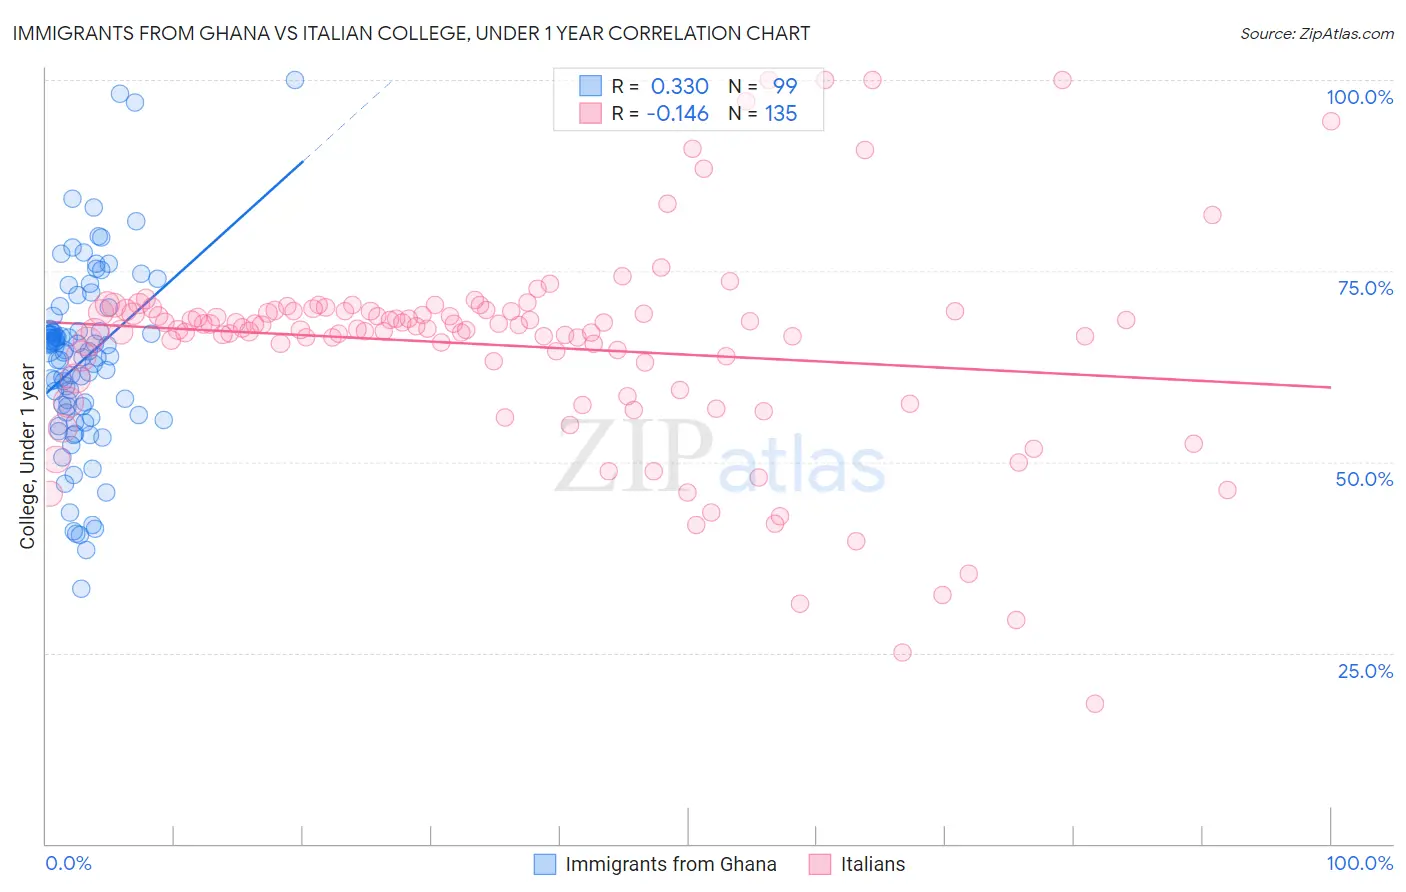
Immigrants from Ghana vs Italian College, Under 1 year Correlation Chart
The statistical analysis conducted on geographies consisting of 199,951,982 people shows a mild positive correlation between the proportion of Immigrants from Ghana and percentage of population with at least college, under 1 year education in the United States with a correlation coefficient (R) of 0.330 and weighted average of 63.1%. Similarly, the statistical analysis conducted on geographies consisting of 575,108,036 people shows a poor negative correlation between the proportion of Italians and percentage of population with at least college, under 1 year education in the United States with a correlation coefficient (R) of -0.146 and weighted average of 67.2%, a difference of 6.5%.
College, Under 1 year Correlation Summary
| Measurement | Immigrants from Ghana | Italian |
| Minimum | 33.5% | 18.4% |
| Maximum | 100.0% | 100.0% |
| Range | 66.5% | 81.6% |
| Mean | 63.3% | 65.2% |
| Median | 64.4% | 67.5% |
| Interquartile 25% (IQ1) | 56.1% | 63.1% |
| Interquartile 75% (IQ3) | 67.3% | 69.8% |
| Interquartile Range (IQR) | 11.2% | 6.7% |
| Standard Deviation (Sample) | 12.1% | 13.7% |
| Standard Deviation (Population) | 12.1% | 13.6% |
Similar Demographics by College, Under 1 year
Demographics Similar to Immigrants from Ghana by College, Under 1 year
In terms of college, under 1 year, the demographic groups most similar to Immigrants from Ghana are Immigrants from Colombia (63.1%, a difference of 0.090%), Immigrants from Peru (63.1%, a difference of 0.11%), Samoan (63.0%, a difference of 0.11%), Liberian (63.0%, a difference of 0.17%), and Subsaharan African (63.2%, a difference of 0.21%).
| Demographics | Rating | Rank | College, Under 1 year |
| Portuguese | 5.6 /100 | #220 | Tragic 63.4% |
| Cree | 5.2 /100 | #221 | Tragic 63.3% |
| Immigrants | Senegal | 5.0 /100 | #222 | Tragic 63.3% |
| Immigrants | Costa Rica | 4.5 /100 | #223 | Tragic 63.2% |
| Sub-Saharan Africans | 4.4 /100 | #224 | Tragic 63.2% |
| Immigrants | Peru | 4.0 /100 | #225 | Tragic 63.1% |
| Immigrants | Colombia | 4.0 /100 | #226 | Tragic 63.1% |
| Immigrants | Ghana | 3.7 /100 | #227 | Tragic 63.1% |
| Samoans | 3.3 /100 | #228 | Tragic 63.0% |
| Liberians | 3.2 /100 | #229 | Tragic 63.0% |
| Immigrants | Nonimmigrants | 3.0 /100 | #230 | Tragic 62.9% |
| Immigrants | Western Africa | 2.4 /100 | #231 | Tragic 62.8% |
| Osage | 2.2 /100 | #232 | Tragic 62.7% |
| Iroquois | 2.0 /100 | #233 | Tragic 62.6% |
| Chippewa | 2.0 /100 | #234 | Tragic 62.6% |
Demographics Similar to Italians by College, Under 1 year
In terms of college, under 1 year, the demographic groups most similar to Italians are Alsatian (67.1%, a difference of 0.060%), Arab (67.2%, a difference of 0.12%), Immigrants from Northern Africa (67.2%, a difference of 0.13%), Czech (67.1%, a difference of 0.14%), and Immigrants from Jordan (67.3%, a difference of 0.15%).
| Demographics | Rating | Rank | College, Under 1 year |
| Immigrants | Ukraine | 94.7 /100 | #118 | Exceptional 67.5% |
| Lebanese | 94.6 /100 | #119 | Exceptional 67.5% |
| Serbians | 93.9 /100 | #120 | Exceptional 67.4% |
| Slovenes | 93.3 /100 | #121 | Exceptional 67.3% |
| Immigrants | Jordan | 92.8 /100 | #122 | Exceptional 67.3% |
| Immigrants | Northern Africa | 92.7 /100 | #123 | Exceptional 67.2% |
| Arabs | 92.6 /100 | #124 | Exceptional 67.2% |
| Italians | 91.8 /100 | #125 | Exceptional 67.2% |
| Alsatians | 91.3 /100 | #126 | Exceptional 67.1% |
| Czechs | 90.8 /100 | #127 | Exceptional 67.1% |
| Scottish | 90.2 /100 | #128 | Exceptional 67.0% |
| Immigrants | Eastern Africa | 89.5 /100 | #129 | Excellent 67.0% |
| Immigrants | Syria | 89.0 /100 | #130 | Excellent 66.9% |
| Finns | 88.6 /100 | #131 | Excellent 66.9% |
| Poles | 88.4 /100 | #132 | Excellent 66.9% |