Immigrants from Afghanistan vs Afghan College, 1 year or more
COMPARE
Immigrants from Afghanistan
Afghan
College, 1 year or more
College, 1 year or more Comparison
Immigrants from Afghanistan
Afghans
60.7%
COLLEGE, 1 YEAR OR MORE
83.1/ 100
METRIC RATING
141st/ 347
METRIC RANK
62.0%
COLLEGE, 1 YEAR OR MORE
96.4/ 100
METRIC RATING
103rd/ 347
METRIC RANK
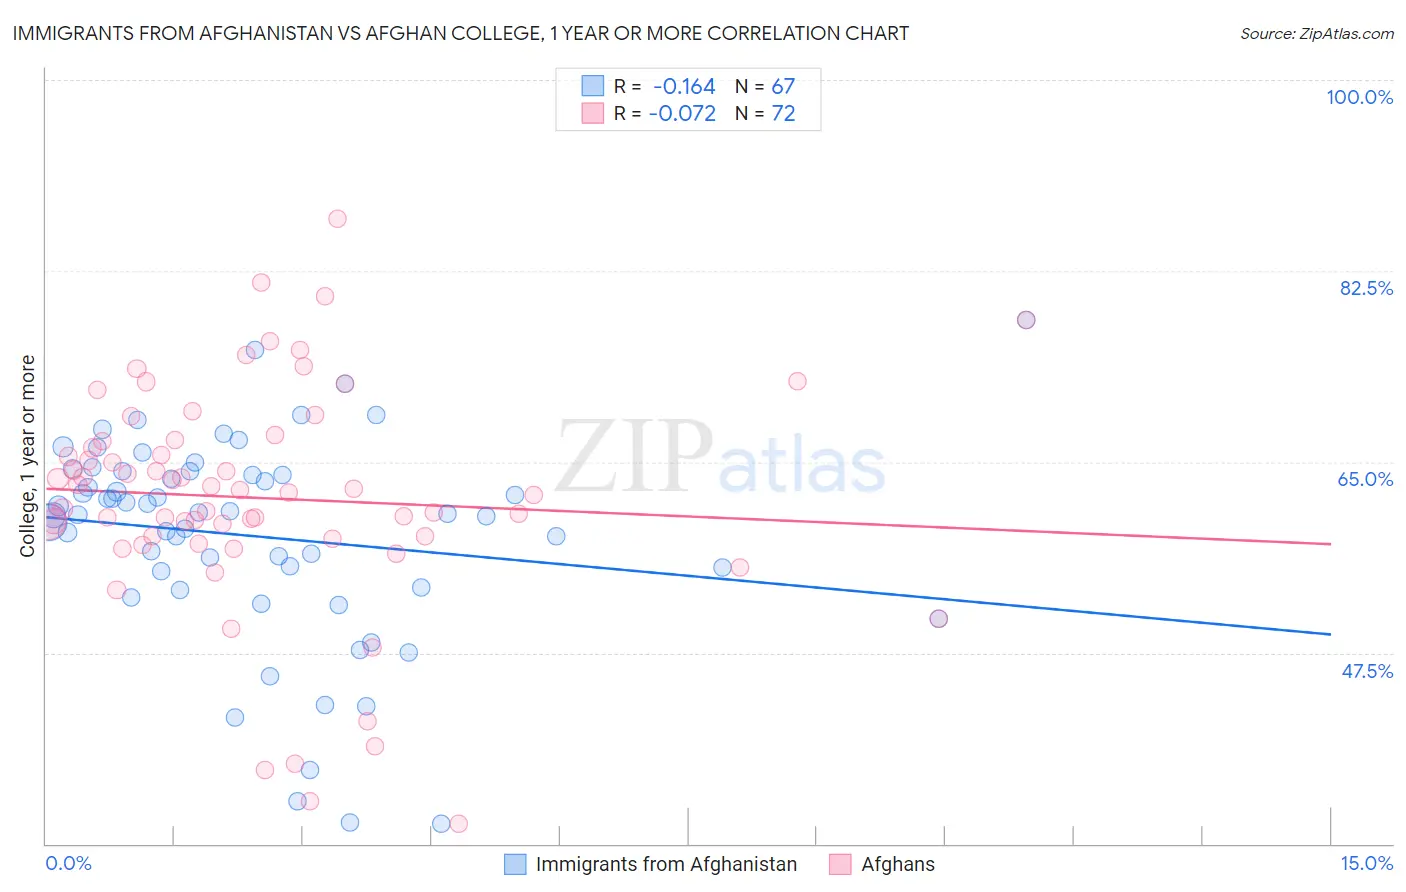
Immigrants from Afghanistan vs Afghan College, 1 year or more Correlation Chart
The statistical analysis conducted on geographies consisting of 147,646,040 people shows a poor negative correlation between the proportion of Immigrants from Afghanistan and percentage of population with at least college, 1 year or more education in the United States with a correlation coefficient (R) of -0.164 and weighted average of 60.7%. Similarly, the statistical analysis conducted on geographies consisting of 148,873,328 people shows a slight negative correlation between the proportion of Afghans and percentage of population with at least college, 1 year or more education in the United States with a correlation coefficient (R) of -0.072 and weighted average of 62.0%, a difference of 2.2%.
College, 1 year or more Correlation Summary
| Measurement | Immigrants from Afghanistan | Afghan |
| Minimum | 31.8% | 31.8% |
| Maximum | 78.0% | 87.2% |
| Range | 46.2% | 55.4% |
| Mean | 58.2% | 61.7% |
| Median | 60.3% | 62.3% |
| Interquartile 25% (IQ1) | 53.4% | 58.0% |
| Interquartile 75% (IQ3) | 64.1% | 67.0% |
| Interquartile Range (IQR) | 10.7% | 8.9% |
| Standard Deviation (Sample) | 9.6% | 10.6% |
| Standard Deviation (Population) | 9.5% | 10.5% |
Similar Demographics by College, 1 year or more
Demographics Similar to Immigrants from Afghanistan by College, 1 year or more
In terms of college, 1 year or more, the demographic groups most similar to Immigrants from Afghanistan are Iraqi (60.7%, a difference of 0.020%), Polish (60.7%, a difference of 0.030%), Canadian (60.6%, a difference of 0.040%), Taiwanese (60.7%, a difference of 0.11%), and Immigrants from Eritrea (60.7%, a difference of 0.11%).
| Demographics | Rating | Rank | College, 1 year or more |
| Immigrants | Venezuela | 87.9 /100 | #134 | Excellent 61.0% |
| Immigrants | Uganda | 87.4 /100 | #135 | Excellent 60.9% |
| Basques | 87.2 /100 | #136 | Excellent 60.9% |
| Slovenes | 86.5 /100 | #137 | Excellent 60.9% |
| Taiwanese | 84.3 /100 | #138 | Excellent 60.7% |
| Immigrants | Eritrea | 84.3 /100 | #139 | Excellent 60.7% |
| Iraqis | 83.3 /100 | #140 | Excellent 60.7% |
| Immigrants | Afghanistan | 83.1 /100 | #141 | Excellent 60.7% |
| Poles | 82.8 /100 | #142 | Excellent 60.7% |
| Canadians | 82.7 /100 | #143 | Excellent 60.6% |
| Czechs | 81.9 /100 | #144 | Excellent 60.6% |
| Slavs | 81.1 /100 | #145 | Excellent 60.6% |
| Scottish | 80.2 /100 | #146 | Excellent 60.5% |
| Immigrants | Kenya | 79.1 /100 | #147 | Good 60.5% |
| Kenyans | 79.0 /100 | #148 | Good 60.5% |
Demographics Similar to Afghans by College, 1 year or more
In terms of college, 1 year or more, the demographic groups most similar to Afghans are Chilean (62.0%, a difference of 0.010%), Immigrants from Nepal (62.0%, a difference of 0.030%), Palestinian (62.0%, a difference of 0.030%), Luxembourger (62.1%, a difference of 0.12%), and Icelander (62.1%, a difference of 0.13%).
| Demographics | Rating | Rank | College, 1 year or more |
| Chinese | 97.2 /100 | #96 | Exceptional 62.2% |
| Jordanians | 97.2 /100 | #97 | Exceptional 62.2% |
| Carpatho Rusyns | 97.2 /100 | #98 | Exceptional 62.2% |
| Croatians | 97.1 /100 | #99 | Exceptional 62.2% |
| Icelanders | 96.8 /100 | #100 | Exceptional 62.1% |
| Swedes | 96.8 /100 | #101 | Exceptional 62.1% |
| Luxembourgers | 96.7 /100 | #102 | Exceptional 62.1% |
| Afghans | 96.4 /100 | #103 | Exceptional 62.0% |
| Chileans | 96.4 /100 | #104 | Exceptional 62.0% |
| Immigrants | Nepal | 96.3 /100 | #105 | Exceptional 62.0% |
| Palestinians | 96.3 /100 | #106 | Exceptional 62.0% |
| Immigrants | Ukraine | 95.8 /100 | #107 | Exceptional 61.9% |
| Syrians | 95.7 /100 | #108 | Exceptional 61.9% |
| Immigrants | Northern Africa | 95.7 /100 | #109 | Exceptional 61.9% |
| Europeans | 95.6 /100 | #110 | Exceptional 61.8% |