Immigrants from Fiji vs Immigrants from Central America College, 1 year or more
COMPARE
Immigrants from Fiji
Immigrants from Central America
College, 1 year or more
College, 1 year or more Comparison
Immigrants from Fiji
Immigrants from Central America
56.9%
COLLEGE, 1 YEAR OR MORE
4.0/ 100
METRIC RATING
228th/ 347
METRIC RANK
48.5%
COLLEGE, 1 YEAR OR MORE
0.0/ 100
METRIC RATING
338th/ 347
METRIC RANK
Immigrants from Fiji vs Immigrants from Central America College, 1 year or more Correlation Chart
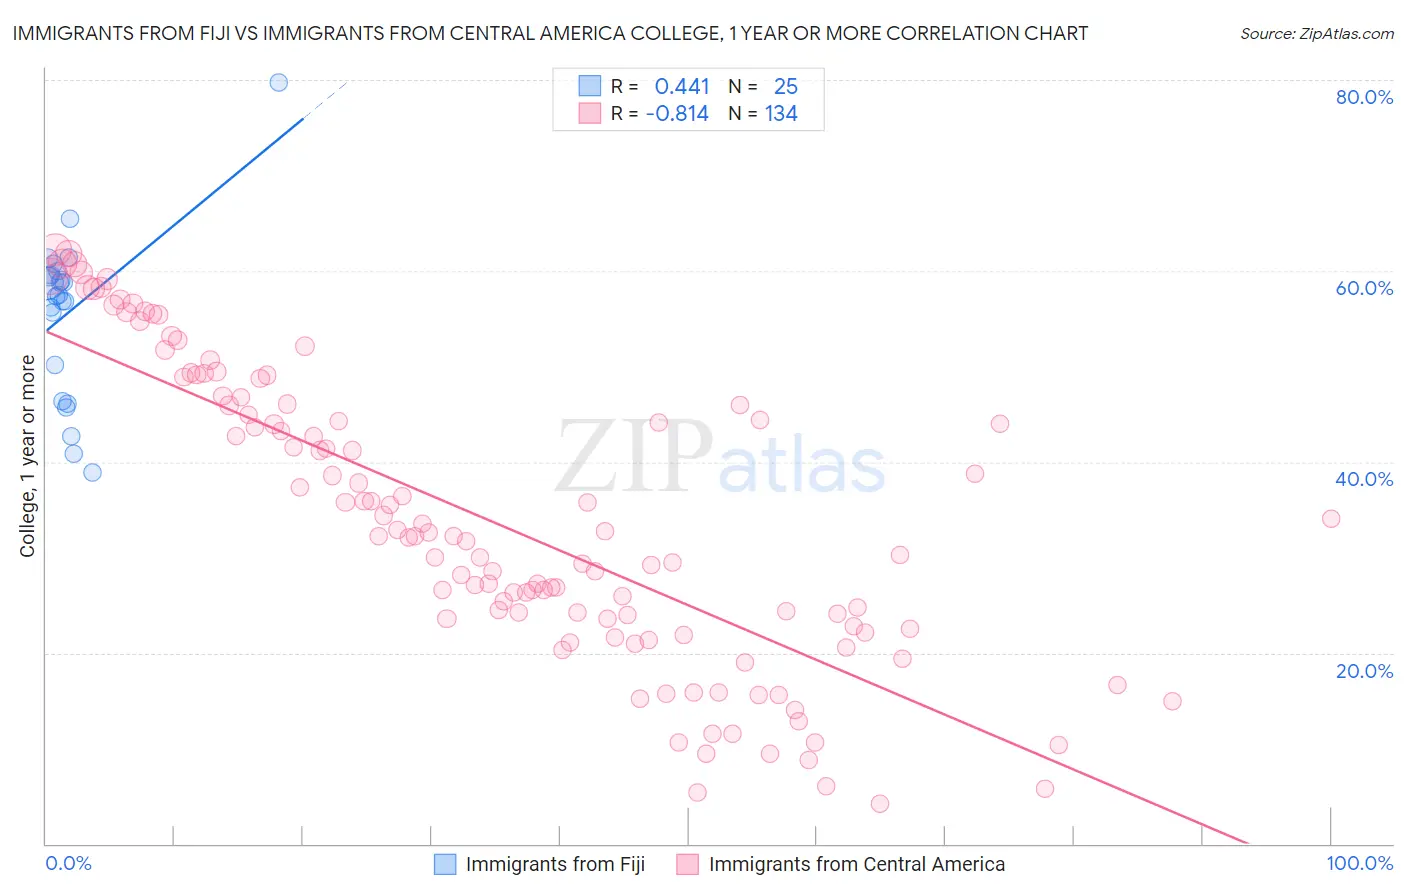
The statistical analysis conducted on geographies consisting of 93,755,737 people shows a moderate positive correlation between the proportion of Immigrants from Fiji and percentage of population with at least college, 1 year or more education in the United States with a correlation coefficient (R) of 0.441 and weighted average of 56.9%. Similarly, the statistical analysis conducted on geographies consisting of 536,538,843 people shows a very strong negative correlation between the proportion of Immigrants from Central America and percentage of population with at least college, 1 year or more education in the United States with a correlation coefficient (R) of -0.814 and weighted average of 48.5%, a difference of 17.4%.
College, 1 year or more Correlation Summary
| Measurement | Immigrants from Fiji | Immigrants from Central America |
| Minimum | 38.9% | 4.2% |
| Maximum | 79.8% | 62.3% |
| Range | 40.9% | 58.1% |
| Mean | 55.8% | 33.7% |
| Median | 57.5% | 32.2% |
| Interquartile 25% (IQ1) | 48.2% | 22.8% |
| Interquartile 75% (IQ3) | 59.8% | 46.0% |
| Interquartile Range (IQR) | 11.5% | 23.2% |
| Standard Deviation (Sample) | 8.8% | 15.2% |
| Standard Deviation (Population) | 8.6% | 15.2% |
Similar Demographics by College, 1 year or more
Demographics Similar to Immigrants from Fiji by College, 1 year or more
In terms of college, 1 year or more, the demographic groups most similar to Immigrants from Fiji are Cree (56.8%, a difference of 0.13%), Immigrants (57.0%, a difference of 0.15%), Immigrants from Western Africa (57.0%, a difference of 0.21%), Vietnamese (57.0%, a difference of 0.24%), and Liberian (56.7%, a difference of 0.35%).
| Demographics | Rating | Rank | College, 1 year or more |
| Immigrants | Ghana | 7.7 /100 | #221 | Tragic 57.4% |
| Sub-Saharan Africans | 6.1 /100 | #222 | Tragic 57.3% |
| Portuguese | 5.4 /100 | #223 | Tragic 57.2% |
| Hmong | 5.4 /100 | #224 | Tragic 57.2% |
| Vietnamese | 4.7 /100 | #225 | Tragic 57.0% |
| Immigrants | Western Africa | 4.6 /100 | #226 | Tragic 57.0% |
| Immigrants | Immigrants | 4.4 /100 | #227 | Tragic 57.0% |
| Immigrants | Fiji | 4.0 /100 | #228 | Tragic 56.9% |
| Cree | 3.6 /100 | #229 | Tragic 56.8% |
| Liberians | 3.1 /100 | #230 | Tragic 56.7% |
| Immigrants | Burma/Myanmar | 2.7 /100 | #231 | Tragic 56.6% |
| Immigrants | Bangladesh | 2.6 /100 | #232 | Tragic 56.6% |
| Immigrants | Nonimmigrants | 2.5 /100 | #233 | Tragic 56.5% |
| Spanish Americans | 1.8 /100 | #234 | Tragic 56.3% |
| West Indians | 1.8 /100 | #235 | Tragic 56.3% |
Demographics Similar to Immigrants from Central America by College, 1 year or more
In terms of college, 1 year or more, the demographic groups most similar to Immigrants from Central America are Pennsylvania German (48.5%, a difference of 0.050%), Spanish American Indian (48.5%, a difference of 0.060%), Immigrants from the Azores (48.4%, a difference of 0.26%), Yuman (48.7%, a difference of 0.50%), and Lumbee (48.9%, a difference of 0.78%).
| Demographics | Rating | Rank | College, 1 year or more |
| Immigrants | Yemen | 0.0 /100 | #331 | Tragic 50.0% |
| Mexicans | 0.0 /100 | #332 | Tragic 49.2% |
| Immigrants | Dominican Republic | 0.0 /100 | #333 | Tragic 49.1% |
| Lumbee | 0.0 /100 | #334 | Tragic 48.9% |
| Yuman | 0.0 /100 | #335 | Tragic 48.7% |
| Spanish American Indians | 0.0 /100 | #336 | Tragic 48.5% |
| Pennsylvania Germans | 0.0 /100 | #337 | Tragic 48.5% |
| Immigrants | Central America | 0.0 /100 | #338 | Tragic 48.5% |
| Immigrants | Azores | 0.0 /100 | #339 | Tragic 48.4% |
| Immigrants | Cabo Verde | 0.0 /100 | #340 | Tragic 48.1% |
| Immigrants | Mexico | 0.0 /100 | #341 | Tragic 47.5% |
| Inupiat | 0.0 /100 | #342 | Tragic 47.2% |
| Tohono O'odham | 0.0 /100 | #343 | Tragic 47.1% |
| Yakama | 0.0 /100 | #344 | Tragic 46.2% |
| Pima | 0.0 /100 | #345 | Tragic 45.6% |