Sudanese vs Immigrants from Vietnam 6th Grade
COMPARE
Sudanese
Immigrants from Vietnam
6th Grade
6th Grade Comparison
Sudanese
Immigrants from Vietnam
96.8%
6TH GRADE
13.9/ 100
METRIC RATING
203rd/ 347
METRIC RANK
95.4%
6TH GRADE
0.0/ 100
METRIC RATING
314th/ 347
METRIC RANK
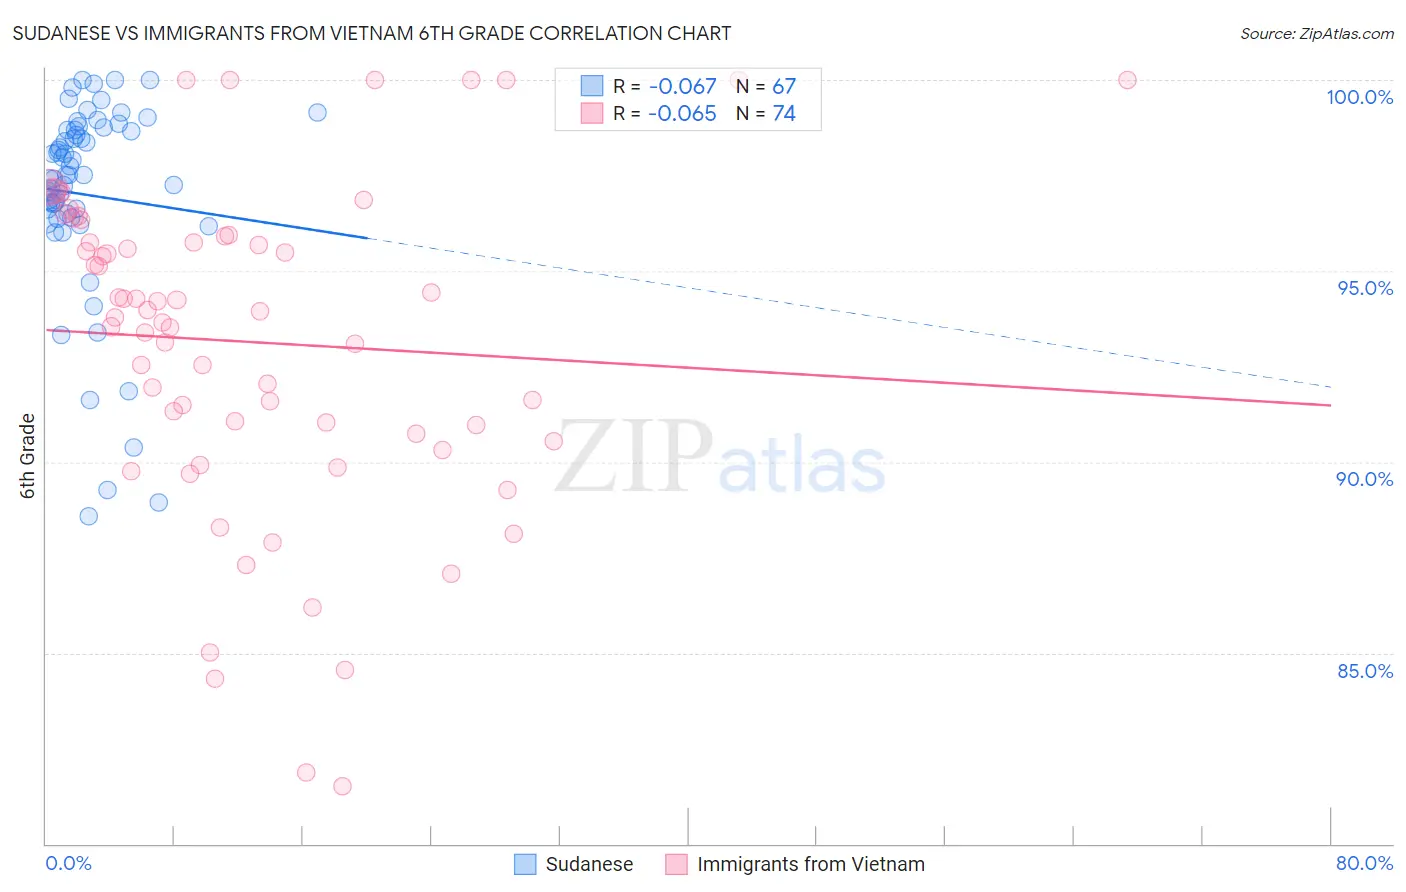
Sudanese vs Immigrants from Vietnam 6th Grade Correlation Chart
The statistical analysis conducted on geographies consisting of 110,114,612 people shows a slight negative correlation between the proportion of Sudanese and percentage of population with at least 6th grade education in the United States with a correlation coefficient (R) of -0.067 and weighted average of 96.8%. Similarly, the statistical analysis conducted on geographies consisting of 404,844,130 people shows a slight negative correlation between the proportion of Immigrants from Vietnam and percentage of population with at least 6th grade education in the United States with a correlation coefficient (R) of -0.065 and weighted average of 95.4%, a difference of 1.5%.
6th Grade Correlation Summary
| Measurement | Sudanese | Immigrants from Vietnam |
| Minimum | 88.6% | 81.5% |
| Maximum | 100.0% | 100.0% |
| Range | 11.4% | 18.5% |
| Mean | 97.0% | 93.1% |
| Median | 97.5% | 93.9% |
| Interquartile 25% (IQ1) | 96.4% | 90.7% |
| Interquartile 75% (IQ3) | 98.7% | 95.9% |
| Interquartile Range (IQR) | 2.3% | 5.2% |
| Standard Deviation (Sample) | 2.6% | 4.3% |
| Standard Deviation (Population) | 2.6% | 4.2% |
Similar Demographics by 6th Grade
Demographics Similar to Sudanese by 6th Grade
In terms of 6th grade, the demographic groups most similar to Sudanese are Immigrants from Chile (96.8%, a difference of 0.0%), Immigrants from Bahamas (96.8%, a difference of 0.0%), African (96.9%, a difference of 0.010%), Immigrants from Zaire (96.9%, a difference of 0.010%), and Native/Alaskan (96.8%, a difference of 0.010%).
| Demographics | Rating | Rank | 6th Grade |
| Immigrants | Uganda | 21.2 /100 | #196 | Fair 96.9% |
| Brazilians | 20.1 /100 | #197 | Fair 96.9% |
| Immigrants | Albania | 18.8 /100 | #198 | Poor 96.9% |
| Immigrants | Northern Africa | 15.7 /100 | #199 | Poor 96.9% |
| Africans | 14.8 /100 | #200 | Poor 96.9% |
| Immigrants | Zaire | 14.5 /100 | #201 | Poor 96.9% |
| Immigrants | Chile | 14.2 /100 | #202 | Poor 96.8% |
| Sudanese | 13.9 /100 | #203 | Poor 96.8% |
| Immigrants | Bahamas | 13.8 /100 | #204 | Poor 96.8% |
| Natives/Alaskans | 13.0 /100 | #205 | Poor 96.8% |
| Laotians | 11.8 /100 | #206 | Poor 96.8% |
| Iraqis | 11.7 /100 | #207 | Poor 96.8% |
| Samoans | 11.0 /100 | #208 | Poor 96.8% |
| Immigrants | Oceania | 11.0 /100 | #209 | Poor 96.8% |
| Immigrants | Nepal | 10.1 /100 | #210 | Poor 96.8% |
Demographics Similar to Immigrants from Vietnam by 6th Grade
In terms of 6th grade, the demographic groups most similar to Immigrants from Vietnam are Nicaraguan (95.4%, a difference of 0.010%), Immigrants from Bangladesh (95.4%, a difference of 0.010%), Japanese (95.4%, a difference of 0.020%), Vietnamese (95.3%, a difference of 0.050%), and Belizean (95.3%, a difference of 0.070%).
| Demographics | Rating | Rank | 6th Grade |
| Guyanese | 0.0 /100 | #307 | Tragic 95.6% |
| Immigrants | Caribbean | 0.0 /100 | #308 | Tragic 95.6% |
| Puerto Ricans | 0.0 /100 | #309 | Tragic 95.5% |
| Ecuadorians | 0.0 /100 | #310 | Tragic 95.5% |
| Immigrants | Portugal | 0.0 /100 | #311 | Tragic 95.5% |
| Immigrants | Guyana | 0.0 /100 | #312 | Tragic 95.5% |
| Nicaraguans | 0.0 /100 | #313 | Tragic 95.4% |
| Immigrants | Vietnam | 0.0 /100 | #314 | Tragic 95.4% |
| Immigrants | Bangladesh | 0.0 /100 | #315 | Tragic 95.4% |
| Japanese | 0.0 /100 | #316 | Tragic 95.4% |
| Vietnamese | 0.0 /100 | #317 | Tragic 95.3% |
| Belizeans | 0.0 /100 | #318 | Tragic 95.3% |
| Immigrants | Belize | 0.0 /100 | #319 | Tragic 95.3% |
| Immigrants | Ecuador | 0.0 /100 | #320 | Tragic 95.3% |
| Immigrants | Fiji | 0.0 /100 | #321 | Tragic 95.2% |