Cape Verdean vs Immigrants from Vietnam 6th Grade
COMPARE
Cape Verdean
Immigrants from Vietnam
6th Grade
6th Grade Comparison
Cape Verdeans
Immigrants from Vietnam
95.1%
6TH GRADE
0.0/ 100
METRIC RATING
324th/ 347
METRIC RANK
95.4%
6TH GRADE
0.0/ 100
METRIC RATING
314th/ 347
METRIC RANK
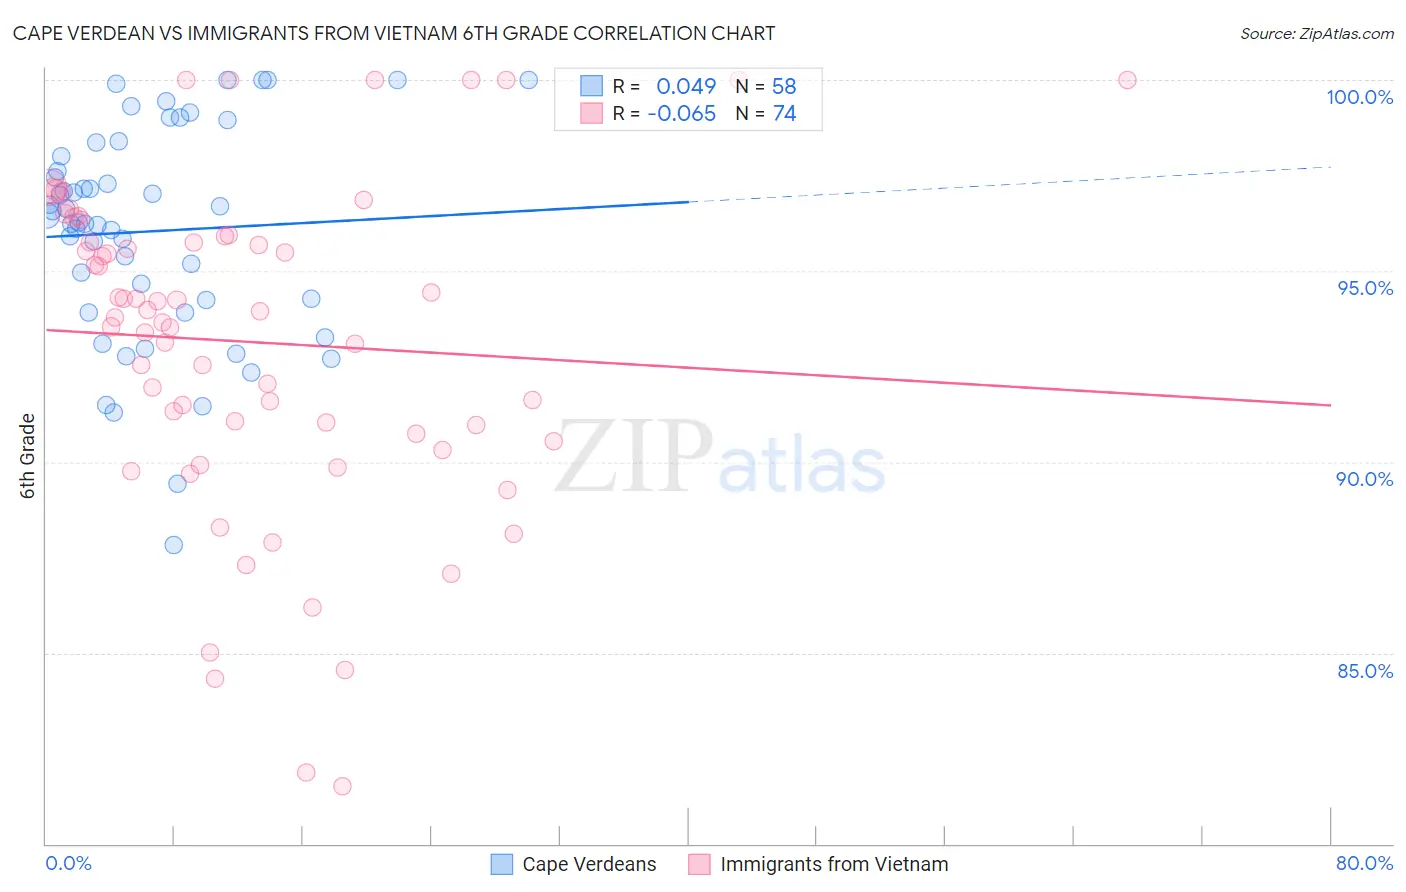
Cape Verdean vs Immigrants from Vietnam 6th Grade Correlation Chart
The statistical analysis conducted on geographies consisting of 107,537,955 people shows no correlation between the proportion of Cape Verdeans and percentage of population with at least 6th grade education in the United States with a correlation coefficient (R) of 0.049 and weighted average of 95.1%. Similarly, the statistical analysis conducted on geographies consisting of 404,844,130 people shows a slight negative correlation between the proportion of Immigrants from Vietnam and percentage of population with at least 6th grade education in the United States with a correlation coefficient (R) of -0.065 and weighted average of 95.4%, a difference of 0.27%.
6th Grade Correlation Summary
| Measurement | Cape Verdean | Immigrants from Vietnam |
| Minimum | 87.8% | 81.5% |
| Maximum | 100.0% | 100.0% |
| Range | 12.2% | 18.5% |
| Mean | 96.0% | 93.1% |
| Median | 96.4% | 93.9% |
| Interquartile 25% (IQ1) | 94.3% | 90.7% |
| Interquartile 75% (IQ3) | 98.0% | 95.9% |
| Interquartile Range (IQR) | 3.8% | 5.2% |
| Standard Deviation (Sample) | 2.8% | 4.3% |
| Standard Deviation (Population) | 2.8% | 4.2% |
Demographics Similar to Cape Verdeans and Immigrants from Vietnam by 6th Grade
In terms of 6th grade, the demographic groups most similar to Cape Verdeans are Central American Indian (95.1%, a difference of 0.030%), Immigrants from Nicaragua (95.1%, a difference of 0.030%), Immigrants from Cambodia (95.2%, a difference of 0.040%), Immigrants from Fiji (95.2%, a difference of 0.090%), and Hispanic or Latino (95.0%, a difference of 0.10%). Similarly, the demographic groups most similar to Immigrants from Vietnam are Nicaraguan (95.4%, a difference of 0.010%), Immigrants from Bangladesh (95.4%, a difference of 0.010%), Japanese (95.4%, a difference of 0.020%), Vietnamese (95.3%, a difference of 0.050%), and Belizean (95.3%, a difference of 0.070%).
| Demographics | Rating | Rank | 6th Grade |
| Puerto Ricans | 0.0 /100 | #309 | Tragic 95.5% |
| Ecuadorians | 0.0 /100 | #310 | Tragic 95.5% |
| Immigrants | Portugal | 0.0 /100 | #311 | Tragic 95.5% |
| Immigrants | Guyana | 0.0 /100 | #312 | Tragic 95.5% |
| Nicaraguans | 0.0 /100 | #313 | Tragic 95.4% |
| Immigrants | Vietnam | 0.0 /100 | #314 | Tragic 95.4% |
| Immigrants | Bangladesh | 0.0 /100 | #315 | Tragic 95.4% |
| Japanese | 0.0 /100 | #316 | Tragic 95.4% |
| Vietnamese | 0.0 /100 | #317 | Tragic 95.3% |
| Belizeans | 0.0 /100 | #318 | Tragic 95.3% |
| Immigrants | Belize | 0.0 /100 | #319 | Tragic 95.3% |
| Immigrants | Ecuador | 0.0 /100 | #320 | Tragic 95.3% |
| Immigrants | Fiji | 0.0 /100 | #321 | Tragic 95.2% |
| Immigrants | Cambodia | 0.0 /100 | #322 | Tragic 95.2% |
| Central American Indians | 0.0 /100 | #323 | Tragic 95.1% |
| Cape Verdeans | 0.0 /100 | #324 | Tragic 95.1% |
| Immigrants | Nicaragua | 0.0 /100 | #325 | Tragic 95.1% |
| Hispanics or Latinos | 0.0 /100 | #326 | Tragic 95.0% |
| Mexican American Indians | 0.0 /100 | #327 | Tragic 95.0% |
| Hondurans | 0.0 /100 | #328 | Tragic 95.0% |
| Dominicans | 0.0 /100 | #329 | Tragic 94.9% |