Kenyan vs Immigrants from Vietnam 6th Grade
COMPARE
Kenyan
Immigrants from Vietnam
6th Grade
6th Grade Comparison
Kenyans
Immigrants from Vietnam
97.1%
6TH GRADE
62.9/ 100
METRIC RATING
159th/ 347
METRIC RANK
95.4%
6TH GRADE
0.0/ 100
METRIC RATING
314th/ 347
METRIC RANK
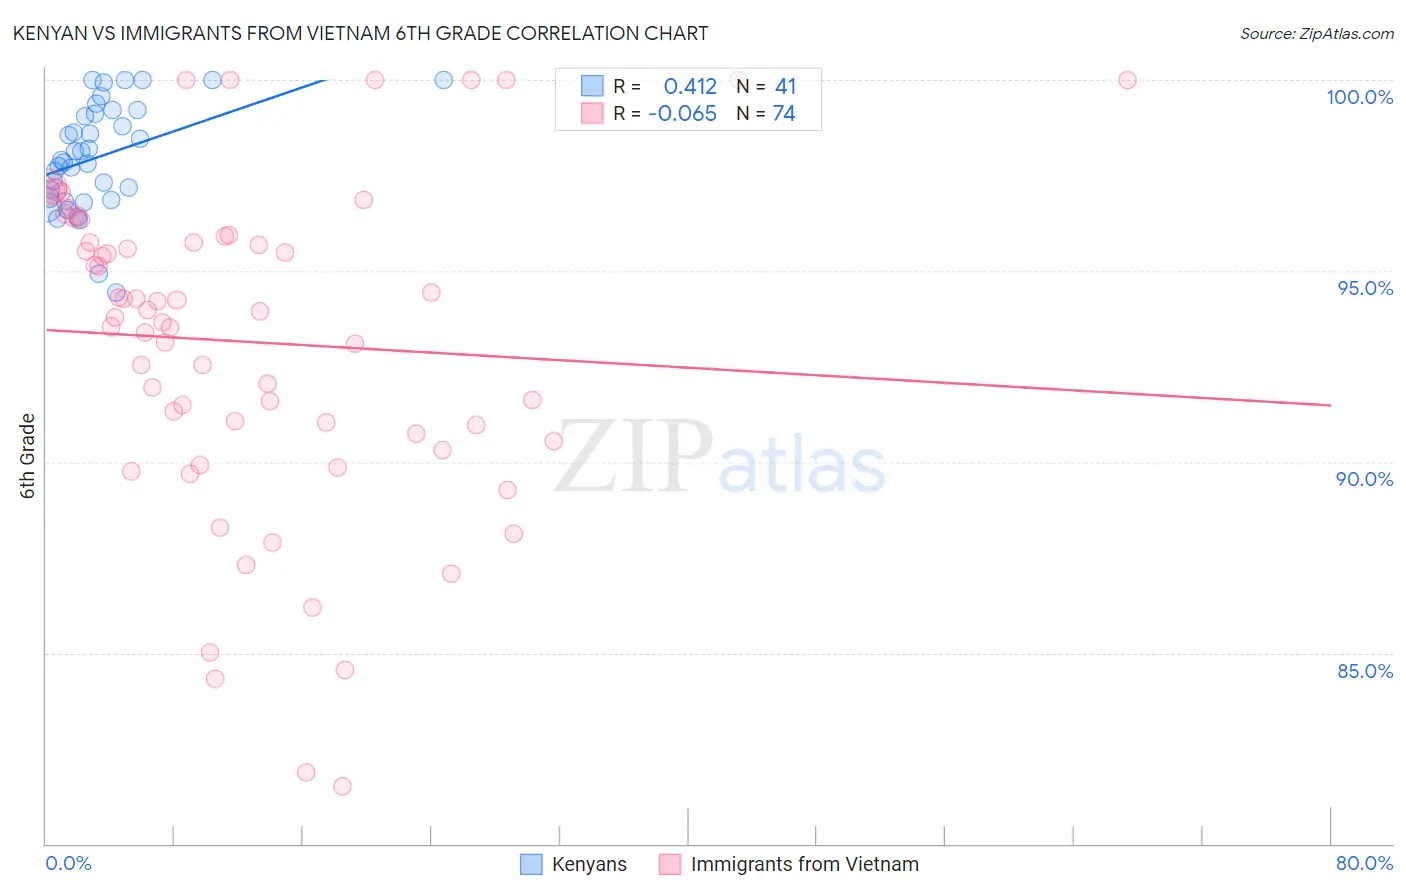
Kenyan vs Immigrants from Vietnam 6th Grade Correlation Chart
The statistical analysis conducted on geographies consisting of 168,244,042 people shows a moderate positive correlation between the proportion of Kenyans and percentage of population with at least 6th grade education in the United States with a correlation coefficient (R) of 0.412 and weighted average of 97.1%. Similarly, the statistical analysis conducted on geographies consisting of 404,844,130 people shows a slight negative correlation between the proportion of Immigrants from Vietnam and percentage of population with at least 6th grade education in the United States with a correlation coefficient (R) of -0.065 and weighted average of 95.4%, a difference of 1.8%.
6th Grade Correlation Summary
| Measurement | Kenyan | Immigrants from Vietnam |
| Minimum | 94.4% | 81.5% |
| Maximum | 100.0% | 100.0% |
| Range | 5.6% | 18.5% |
| Mean | 98.0% | 93.1% |
| Median | 97.9% | 93.9% |
| Interquartile 25% (IQ1) | 96.9% | 90.7% |
| Interquartile 75% (IQ3) | 99.2% | 95.9% |
| Interquartile Range (IQR) | 2.3% | 5.2% |
| Standard Deviation (Sample) | 1.4% | 4.3% |
| Standard Deviation (Population) | 1.4% | 4.2% |
Similar Demographics by 6th Grade
Demographics Similar to Kenyans by 6th Grade
In terms of 6th grade, the demographic groups most similar to Kenyans are Immigrants from Iran (97.1%, a difference of 0.0%), Ugandan (97.1%, a difference of 0.0%), Immigrants from Belarus (97.1%, a difference of 0.010%), Marshallese (97.1%, a difference of 0.010%), and Immigrants from Russia (97.1%, a difference of 0.020%).
| Demographics | Rating | Rank | 6th Grade |
| Immigrants | Jordan | 73.0 /100 | #152 | Good 97.2% |
| Immigrants | Eastern Europe | 72.6 /100 | #153 | Good 97.2% |
| Soviet Union | 71.5 /100 | #154 | Good 97.2% |
| Ute | 71.1 /100 | #155 | Good 97.1% |
| Alsatians | 69.8 /100 | #156 | Good 97.1% |
| Immigrants | Russia | 67.6 /100 | #157 | Good 97.1% |
| Immigrants | Iran | 63.3 /100 | #158 | Good 97.1% |
| Kenyans | 62.9 /100 | #159 | Good 97.1% |
| Ugandans | 62.2 /100 | #160 | Good 97.1% |
| Immigrants | Belarus | 60.4 /100 | #161 | Good 97.1% |
| Marshallese | 60.2 /100 | #162 | Good 97.1% |
| Albanians | 57.8 /100 | #163 | Average 97.1% |
| Immigrants | Korea | 57.7 /100 | #164 | Average 97.1% |
| Immigrants | Poland | 56.2 /100 | #165 | Average 97.1% |
| Immigrants | Italy | 53.8 /100 | #166 | Average 97.1% |
Demographics Similar to Immigrants from Vietnam by 6th Grade
In terms of 6th grade, the demographic groups most similar to Immigrants from Vietnam are Nicaraguan (95.4%, a difference of 0.010%), Immigrants from Bangladesh (95.4%, a difference of 0.010%), Japanese (95.4%, a difference of 0.020%), Vietnamese (95.3%, a difference of 0.050%), and Belizean (95.3%, a difference of 0.070%).
| Demographics | Rating | Rank | 6th Grade |
| Guyanese | 0.0 /100 | #307 | Tragic 95.6% |
| Immigrants | Caribbean | 0.0 /100 | #308 | Tragic 95.6% |
| Puerto Ricans | 0.0 /100 | #309 | Tragic 95.5% |
| Ecuadorians | 0.0 /100 | #310 | Tragic 95.5% |
| Immigrants | Portugal | 0.0 /100 | #311 | Tragic 95.5% |
| Immigrants | Guyana | 0.0 /100 | #312 | Tragic 95.5% |
| Nicaraguans | 0.0 /100 | #313 | Tragic 95.4% |
| Immigrants | Vietnam | 0.0 /100 | #314 | Tragic 95.4% |
| Immigrants | Bangladesh | 0.0 /100 | #315 | Tragic 95.4% |
| Japanese | 0.0 /100 | #316 | Tragic 95.4% |
| Vietnamese | 0.0 /100 | #317 | Tragic 95.3% |
| Belizeans | 0.0 /100 | #318 | Tragic 95.3% |
| Immigrants | Belize | 0.0 /100 | #319 | Tragic 95.3% |
| Immigrants | Ecuador | 0.0 /100 | #320 | Tragic 95.3% |
| Immigrants | Fiji | 0.0 /100 | #321 | Tragic 95.2% |