Immigrants from Eritrea vs Immigrants from Afghanistan 6th Grade
COMPARE
Immigrants from Eritrea
Immigrants from Afghanistan
6th Grade
6th Grade Comparison
Immigrants from Eritrea
Immigrants from Afghanistan
96.1%
6TH GRADE
0.0/ 100
METRIC RATING
289th/ 347
METRIC RANK
96.2%
6TH GRADE
0.1/ 100
METRIC RATING
280th/ 347
METRIC RANK
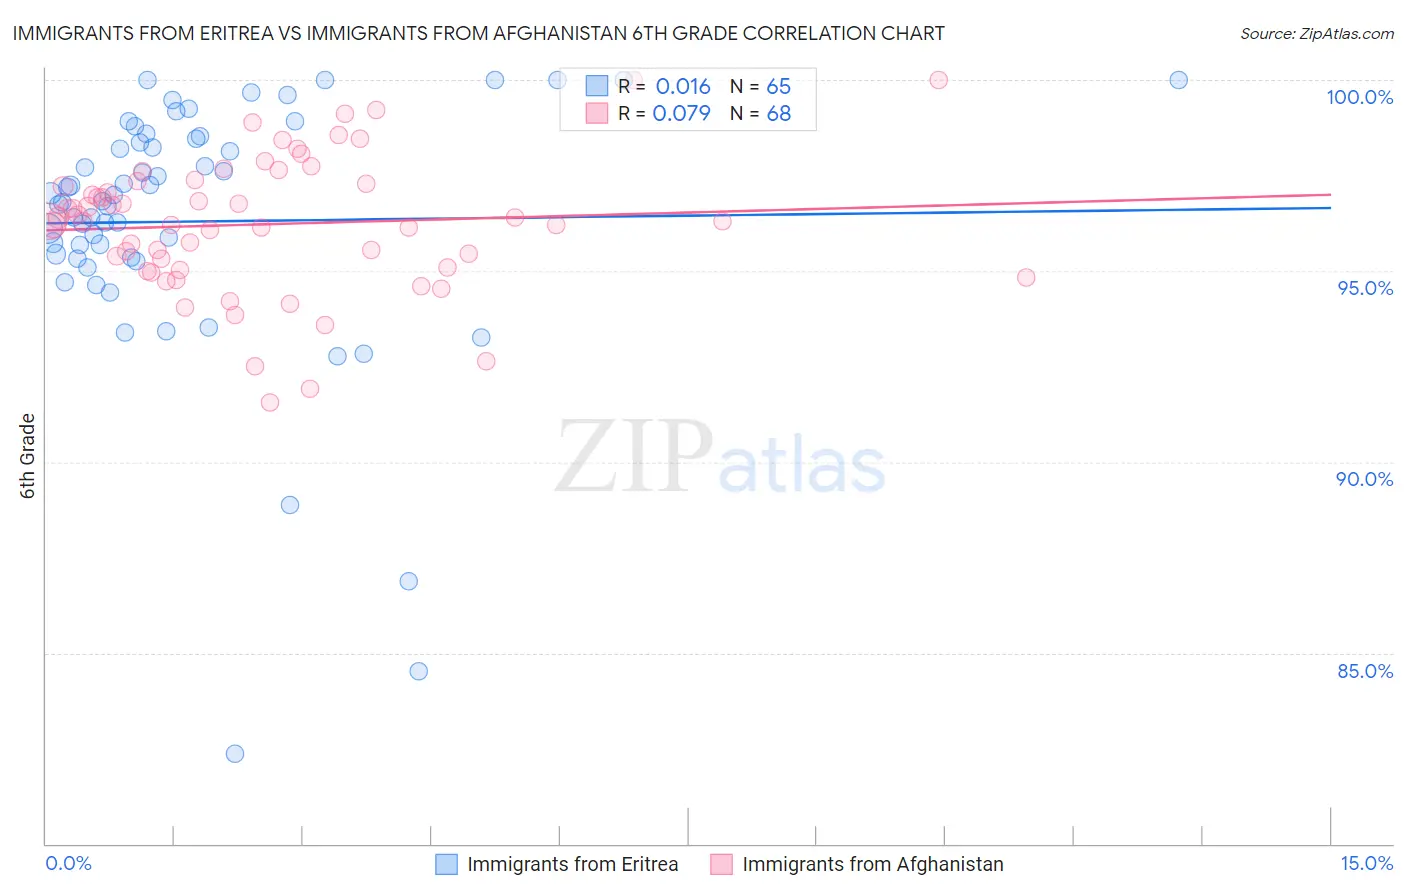
Immigrants from Eritrea vs Immigrants from Afghanistan 6th Grade Correlation Chart
The statistical analysis conducted on geographies consisting of 104,764,182 people shows no correlation between the proportion of Immigrants from Eritrea and percentage of population with at least 6th grade education in the United States with a correlation coefficient (R) of 0.016 and weighted average of 96.1%. Similarly, the statistical analysis conducted on geographies consisting of 147,629,924 people shows a slight positive correlation between the proportion of Immigrants from Afghanistan and percentage of population with at least 6th grade education in the United States with a correlation coefficient (R) of 0.079 and weighted average of 96.2%, a difference of 0.11%.
6th Grade Correlation Summary
| Measurement | Immigrants from Eritrea | Immigrants from Afghanistan |
| Minimum | 82.4% | 91.6% |
| Maximum | 100.0% | 100.0% |
| Range | 17.6% | 8.4% |
| Mean | 96.3% | 96.2% |
| Median | 96.8% | 96.3% |
| Interquartile 25% (IQ1) | 95.3% | 95.1% |
| Interquartile 75% (IQ3) | 98.5% | 97.3% |
| Interquartile Range (IQR) | 3.2% | 2.2% |
| Standard Deviation (Sample) | 3.4% | 1.8% |
| Standard Deviation (Population) | 3.4% | 1.8% |
Demographics Similar to Immigrants from Eritrea and Immigrants from Afghanistan by 6th Grade
In terms of 6th grade, the demographic groups most similar to Immigrants from Eritrea are Malaysian (96.2%, a difference of 0.020%), Immigrants from Somalia (96.1%, a difference of 0.020%), Immigrants from St. Vincent and the Grenadines (96.1%, a difference of 0.020%), Immigrants from Trinidad and Tobago (96.2%, a difference of 0.030%), and Barbadian (96.2%, a difference of 0.040%). Similarly, the demographic groups most similar to Immigrants from Afghanistan are Immigrants from Peru (96.2%, a difference of 0.0%), Trinidadian and Tobagonian (96.2%, a difference of 0.0%), Houma (96.2%, a difference of 0.0%), Immigrants from Western Africa (96.3%, a difference of 0.020%), and Immigrants from Thailand (96.3%, a difference of 0.020%).
| Demographics | Rating | Rank | 6th Grade |
| Immigrants | Philippines | 0.1 /100 | #274 | Tragic 96.3% |
| Immigrants | Ghana | 0.1 /100 | #275 | Tragic 96.3% |
| Yaqui | 0.1 /100 | #276 | Tragic 96.3% |
| Immigrants | Western Africa | 0.1 /100 | #277 | Tragic 96.3% |
| Immigrants | Thailand | 0.1 /100 | #278 | Tragic 96.3% |
| Immigrants | Peru | 0.1 /100 | #279 | Tragic 96.2% |
| Immigrants | Afghanistan | 0.1 /100 | #280 | Tragic 96.2% |
| Trinidadians and Tobagonians | 0.1 /100 | #281 | Tragic 96.2% |
| Houma | 0.1 /100 | #282 | Tragic 96.2% |
| Cubans | 0.1 /100 | #283 | Tragic 96.2% |
| Fijians | 0.1 /100 | #284 | Tragic 96.2% |
| Somalis | 0.1 /100 | #285 | Tragic 96.2% |
| Barbadians | 0.0 /100 | #286 | Tragic 96.2% |
| Immigrants | Trinidad and Tobago | 0.0 /100 | #287 | Tragic 96.2% |
| Malaysians | 0.0 /100 | #288 | Tragic 96.2% |
| Immigrants | Eritrea | 0.0 /100 | #289 | Tragic 96.1% |
| Immigrants | Somalia | 0.0 /100 | #290 | Tragic 96.1% |
| Immigrants | St. Vincent and the Grenadines | 0.0 /100 | #291 | Tragic 96.1% |
| Immigrants | Barbados | 0.0 /100 | #292 | Tragic 96.1% |
| Immigrants | West Indies | 0.0 /100 | #293 | Tragic 96.1% |
| British West Indians | 0.0 /100 | #294 | Tragic 96.0% |