Immigrants from Denmark vs Immigrants from Vietnam 6th Grade
COMPARE
Immigrants from Denmark
Immigrants from Vietnam
6th Grade
6th Grade Comparison
Immigrants from Denmark
Immigrants from Vietnam
97.5%
6TH GRADE
98.5/ 100
METRIC RATING
98th/ 347
METRIC RANK
95.4%
6TH GRADE
0.0/ 100
METRIC RATING
314th/ 347
METRIC RANK
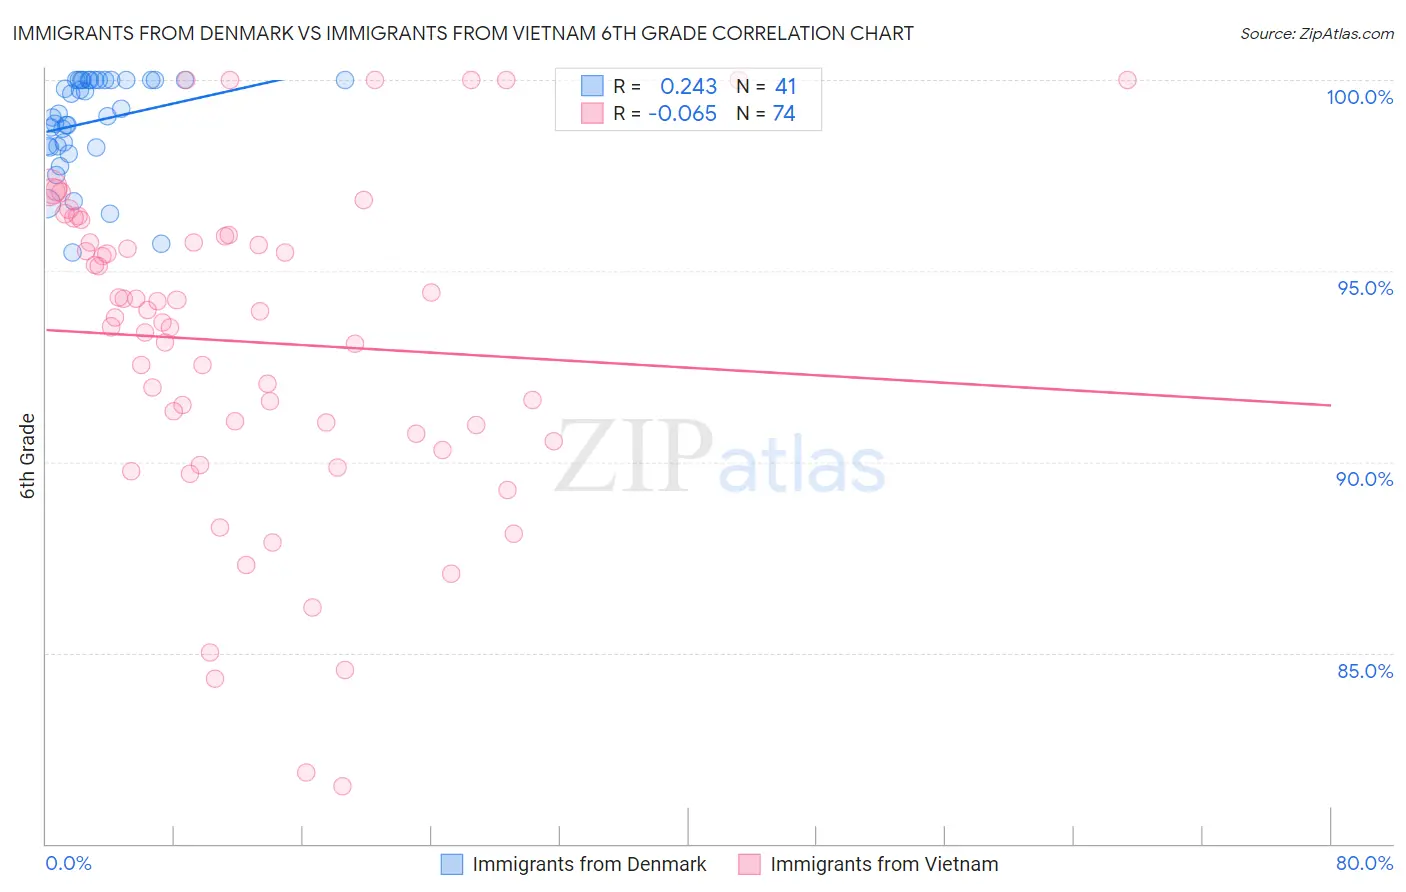
Immigrants from Denmark vs Immigrants from Vietnam 6th Grade Correlation Chart
The statistical analysis conducted on geographies consisting of 136,430,932 people shows a weak positive correlation between the proportion of Immigrants from Denmark and percentage of population with at least 6th grade education in the United States with a correlation coefficient (R) of 0.243 and weighted average of 97.5%. Similarly, the statistical analysis conducted on geographies consisting of 404,844,130 people shows a slight negative correlation between the proportion of Immigrants from Vietnam and percentage of population with at least 6th grade education in the United States with a correlation coefficient (R) of -0.065 and weighted average of 95.4%, a difference of 2.2%.
6th Grade Correlation Summary
| Measurement | Immigrants from Denmark | Immigrants from Vietnam |
| Minimum | 95.5% | 81.5% |
| Maximum | 100.0% | 100.0% |
| Range | 4.5% | 18.5% |
| Mean | 98.9% | 93.1% |
| Median | 99.1% | 93.9% |
| Interquartile 25% (IQ1) | 98.3% | 90.7% |
| Interquartile 75% (IQ3) | 100.0% | 95.9% |
| Interquartile Range (IQR) | 1.7% | 5.2% |
| Standard Deviation (Sample) | 1.3% | 4.3% |
| Standard Deviation (Population) | 1.2% | 4.2% |
Similar Demographics by 6th Grade
Demographics Similar to Immigrants from Denmark by 6th Grade
In terms of 6th grade, the demographic groups most similar to Immigrants from Denmark are Yugoslavian (97.5%, a difference of 0.0%), Romanian (97.5%, a difference of 0.010%), Cree (97.5%, a difference of 0.010%), Cypriot (97.5%, a difference of 0.010%), and Immigrants from Ireland (97.5%, a difference of 0.010%).
| Demographics | Rating | Rank | 6th Grade |
| Immigrants | Western Europe | 98.8 /100 | #91 | Exceptional 97.5% |
| Romanians | 98.7 /100 | #92 | Exceptional 97.5% |
| Cree | 98.7 /100 | #93 | Exceptional 97.5% |
| Cypriots | 98.7 /100 | #94 | Exceptional 97.5% |
| Immigrants | Ireland | 98.7 /100 | #95 | Exceptional 97.5% |
| Immigrants | Germany | 98.6 /100 | #96 | Exceptional 97.5% |
| Immigrants | Sweden | 98.6 /100 | #97 | Exceptional 97.5% |
| Immigrants | Denmark | 98.5 /100 | #98 | Exceptional 97.5% |
| Yugoslavians | 98.5 /100 | #99 | Exceptional 97.5% |
| Turks | 98.3 /100 | #100 | Exceptional 97.5% |
| South Africans | 98.2 /100 | #101 | Exceptional 97.5% |
| Choctaw | 98.0 /100 | #102 | Exceptional 97.5% |
| Bhutanese | 98.0 /100 | #103 | Exceptional 97.5% |
| German Russians | 97.9 /100 | #104 | Exceptional 97.5% |
| Cheyenne | 97.9 /100 | #105 | Exceptional 97.5% |
Demographics Similar to Immigrants from Vietnam by 6th Grade
In terms of 6th grade, the demographic groups most similar to Immigrants from Vietnam are Nicaraguan (95.4%, a difference of 0.010%), Immigrants from Bangladesh (95.4%, a difference of 0.010%), Japanese (95.4%, a difference of 0.020%), Vietnamese (95.3%, a difference of 0.050%), and Belizean (95.3%, a difference of 0.070%).
| Demographics | Rating | Rank | 6th Grade |
| Guyanese | 0.0 /100 | #307 | Tragic 95.6% |
| Immigrants | Caribbean | 0.0 /100 | #308 | Tragic 95.6% |
| Puerto Ricans | 0.0 /100 | #309 | Tragic 95.5% |
| Ecuadorians | 0.0 /100 | #310 | Tragic 95.5% |
| Immigrants | Portugal | 0.0 /100 | #311 | Tragic 95.5% |
| Immigrants | Guyana | 0.0 /100 | #312 | Tragic 95.5% |
| Nicaraguans | 0.0 /100 | #313 | Tragic 95.4% |
| Immigrants | Vietnam | 0.0 /100 | #314 | Tragic 95.4% |
| Immigrants | Bangladesh | 0.0 /100 | #315 | Tragic 95.4% |
| Japanese | 0.0 /100 | #316 | Tragic 95.4% |
| Vietnamese | 0.0 /100 | #317 | Tragic 95.3% |
| Belizeans | 0.0 /100 | #318 | Tragic 95.3% |
| Immigrants | Belize | 0.0 /100 | #319 | Tragic 95.3% |
| Immigrants | Ecuador | 0.0 /100 | #320 | Tragic 95.3% |
| Immigrants | Fiji | 0.0 /100 | #321 | Tragic 95.2% |