Immigrants from Hungary vs Immigrants from the Azores College, Under 1 year
COMPARE
Immigrants from Hungary
Immigrants from the Azores
College, Under 1 year
College, Under 1 year Comparison
Immigrants from Hungary
Immigrants from the Azores
68.3%
COLLEGE, UNDER 1 YEAR
98.3/ 100
METRIC RATING
84th/ 347
METRIC RANK
54.7%
COLLEGE, UNDER 1 YEAR
0.0/ 100
METRIC RATING
334th/ 347
METRIC RANK
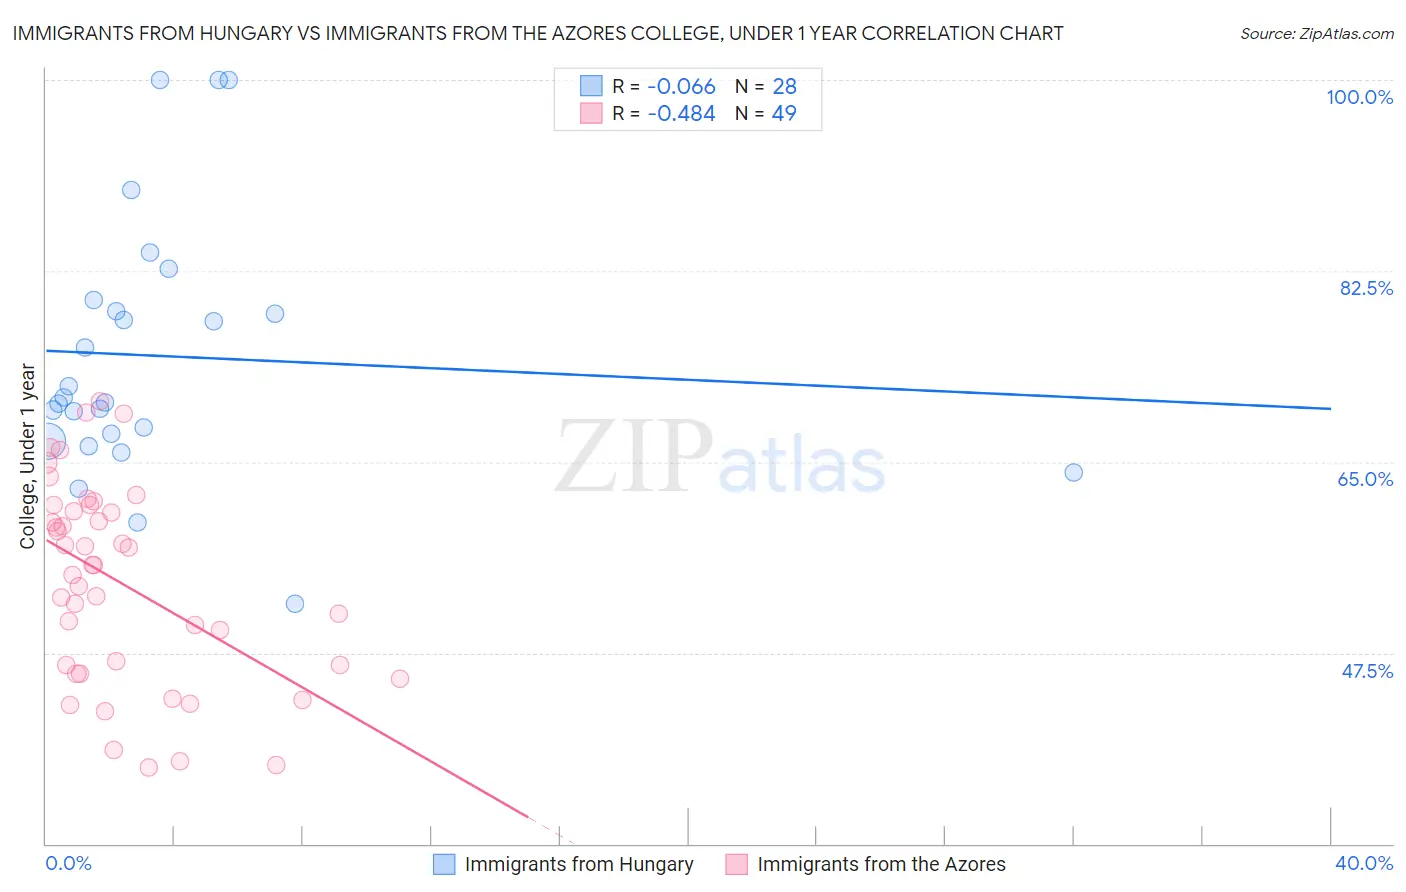
Immigrants from Hungary vs Immigrants from the Azores College, Under 1 year Correlation Chart
The statistical analysis conducted on geographies consisting of 195,707,305 people shows a slight negative correlation between the proportion of Immigrants from Hungary and percentage of population with at least college, under 1 year education in the United States with a correlation coefficient (R) of -0.066 and weighted average of 68.3%. Similarly, the statistical analysis conducted on geographies consisting of 46,257,310 people shows a moderate negative correlation between the proportion of Immigrants from the Azores and percentage of population with at least college, under 1 year education in the United States with a correlation coefficient (R) of -0.484 and weighted average of 54.7%, a difference of 25.0%.
College, Under 1 year Correlation Summary
| Measurement | Immigrants from Hungary | Immigrants from the Azores |
| Minimum | 52.0% | 36.9% |
| Maximum | 100.0% | 70.6% |
| Range | 48.0% | 33.6% |
| Mean | 74.7% | 53.9% |
| Median | 70.7% | 55.6% |
| Interquartile 25% (IQ1) | 67.3% | 46.0% |
| Interquartile 75% (IQ3) | 79.3% | 60.8% |
| Interquartile Range (IQR) | 12.1% | 14.8% |
| Standard Deviation (Sample) | 11.9% | 9.1% |
| Standard Deviation (Population) | 11.7% | 9.0% |
Similar Demographics by College, Under 1 year
Demographics Similar to Immigrants from Hungary by College, Under 1 year
In terms of college, under 1 year, the demographic groups most similar to Immigrants from Hungary are Egyptian (68.3%, a difference of 0.010%), Immigrants from Lebanon (68.3%, a difference of 0.010%), Argentinean (68.4%, a difference of 0.020%), Chinese (68.3%, a difference of 0.030%), and Norwegian (68.4%, a difference of 0.040%).
| Demographics | Rating | Rank | College, Under 1 year |
| British | 98.6 /100 | #77 | Exceptional 68.5% |
| Danes | 98.6 /100 | #78 | Exceptional 68.5% |
| Greeks | 98.6 /100 | #79 | Exceptional 68.5% |
| Immigrants | Spain | 98.5 /100 | #80 | Exceptional 68.4% |
| Immigrants | Greece | 98.5 /100 | #81 | Exceptional 68.4% |
| Norwegians | 98.4 /100 | #82 | Exceptional 68.4% |
| Argentineans | 98.4 /100 | #83 | Exceptional 68.4% |
| Immigrants | Hungary | 98.3 /100 | #84 | Exceptional 68.3% |
| Egyptians | 98.3 /100 | #85 | Exceptional 68.3% |
| Immigrants | Lebanon | 98.3 /100 | #86 | Exceptional 68.3% |
| Chinese | 98.3 /100 | #87 | Exceptional 68.3% |
| Croatians | 98.2 /100 | #88 | Exceptional 68.3% |
| Ethiopians | 98.2 /100 | #89 | Exceptional 68.3% |
| Icelanders | 98.1 /100 | #90 | Exceptional 68.3% |
| Europeans | 98.1 /100 | #91 | Exceptional 68.2% |
Demographics Similar to Immigrants from the Azores by College, Under 1 year
In terms of college, under 1 year, the demographic groups most similar to Immigrants from the Azores are Inupiat (54.6%, a difference of 0.13%), Pennsylvania German (54.5%, a difference of 0.30%), Immigrants from Central America (54.4%, a difference of 0.45%), Yuman (55.1%, a difference of 0.72%), and Lumbee (54.2%, a difference of 0.86%).
| Demographics | Rating | Rank | College, Under 1 year |
| Immigrants | Guatemala | 0.0 /100 | #327 | Tragic 56.2% |
| Cape Verdeans | 0.0 /100 | #328 | Tragic 56.0% |
| Immigrants | Cuba | 0.0 /100 | #329 | Tragic 55.7% |
| Mexicans | 0.0 /100 | #330 | Tragic 55.6% |
| Dominicans | 0.0 /100 | #331 | Tragic 55.5% |
| Immigrants | Yemen | 0.0 /100 | #332 | Tragic 55.3% |
| Yuman | 0.0 /100 | #333 | Tragic 55.1% |
| Immigrants | Azores | 0.0 /100 | #334 | Tragic 54.7% |
| Inupiat | 0.0 /100 | #335 | Tragic 54.6% |
| Pennsylvania Germans | 0.0 /100 | #336 | Tragic 54.5% |
| Immigrants | Central America | 0.0 /100 | #337 | Tragic 54.4% |
| Lumbee | 0.0 /100 | #338 | Tragic 54.2% |
| Immigrants | Dominican Republic | 0.0 /100 | #339 | Tragic 54.0% |
| Spanish American Indians | 0.0 /100 | #340 | Tragic 54.0% |
| Immigrants | Cabo Verde | 0.0 /100 | #341 | Tragic 53.7% |