Immigrants from Ecuador vs Costa Rican Cognitive Disability

COMPARE

Immigrants from Ecuador
Race
Ancestry
AfghanAfricanAlaska NativeAlaskan AthabascanAlbanianAleutAlsatianAmericanApacheArabArapahoArgentineanArmenianAssyrian/Chaldean/SyriacAustralianAustrianBahamianBangladeshiBarbadianBasqueBelgianBelizeanBermudanBhutaneseBlackfeetBolivianBrazilianBritishBritish West IndianBulgarianBurmeseCajunCambodianCanadianCape VerdeanCarpatho RusynCelticCentral AmericanCentral American IndianCherokeeCheyenneChickasawChileanChineseChippewaChoctawColombianColvilleComancheCreeCreekCroatianCrowCubanCypriotCzechCzechoslovakianDanishDelawareDominicanDutchDutch West IndianEastern EuropeanEcuadorianEgyptianEnglishEstonianEthiopianEuropeanFijianFilipinoFinnishFrenchFrench American IndianFrench CanadianGermanGerman RussianGhanaianGreekGuamanian/ChamorroGuatemalanGuyaneseHaitianHmongHonduranHopiHoumaHungarianIcelanderIndian (Asian)IndonesianInupiatIranianIraqiIrishIroquoisIsraeliItalianJamaicanJapaneseJordanianKenyanKiowaKoreanLaotianLatvianLebaneseLiberianLithuanianLumbeeLuxembourgerMacedonianMalaysianMalteseMarshalleseMenomineeMexicanMexican American IndianMongolianMoroccanNative HawaiianNavajoNepaleseNew ZealanderNicaraguanNigerianNorthern EuropeanNorwegianOkinawanOsageOttawaPaiutePakistaniPalestinianPanamanianParaguayanPennsylvania GermanPeruvianPimaPolishPortuguesePotawatomiPuebloPuerto RicanPuget Sound SalishRomanianRussianSalvadoranSamoanScandinavianScotch-IrishScottishSeminoleSenegaleseSerbianShoshoneSierra LeoneanSiouxSlavicSlovakSloveneSomaliSouth AfricanSouth AmericanSouth American IndianSoviet UnionSpaniardSpanishSpanish AmericanSpanish American IndianSri LankanSubsaharan AfricanSudaneseSwedishSwissSyrianTaiwaneseThaiTlingit-HaidaTohono O'OdhamTonganTrinidadian and TobagonianTsimshianTurkishU.S. Virgin IslanderUgandanUkrainianUruguayanUteVenezuelanVietnameseWelshWest IndianYakamaYaquiYugoslavianYumanYup'ikZimbabwean
Immigration
NonimmigrantsImmigrantsAfghanistanAfricaAlbaniaArgentinaArmeniaAsiaAustraliaAustriaBahamasBangladeshBarbadosBelarusBelgiumBelizeBoliviaBosnia and HerzegovinaBrazilBulgariaBurma/MyanmarCabo VerdeCambodiaCameroonCanadaCaribbeanCentral AmericaChileChinaColombiaCongoCosta RicaCroatiaCubaCzechoslovakiaDenmarkDominicaDominican RepublicEastern AfricaEastern AsiaEastern EuropeEcuadorEgyptEl SalvadorEnglandEritreaEthiopiaEuropeFijiFranceGermanyGhanaGreeceGrenadaGuatemalaGuyanaHaitiHondurasHong KongHungaryIndiaIndonesiaIranIraqIrelandIsraelItalyJamaicaJapanJordanKazakhstanKenyaKoreaKuwaitLaosLatin AmericaLatviaLebanonLiberiaLithuaniaMalaysiaMexicoMicronesiaMiddle AfricaMoldovaMoroccoNepalNetherlandsNicaraguaNigeriaNorth AmericaNorth MacedoniaNorthern AfricaNorthern EuropeNorwayOceaniaPakistanPanamaPeruPhilippinesPolandPortugalRomaniaRussiaSaudi ArabiaScotlandSenegalSerbiaSierra LeoneSingaporeSomaliaSouth AfricaSouth AmericaSouth Central AsiaSouth Eastern AsiaSouthern EuropeSpainSri LankaSt. Vincent and the GrenadinesSudanSwedenSwitzerlandSyriaTaiwanThailandTrinidad and TobagoTurkeyUgandaUkraineUruguayUzbekistanVenezuelaVietnamWest IndiesWestern AfricaWestern AsiaWestern EuropeYemenZaireZimbabweAzores
Costa Rican
Race
Ancestry
AfghanAfricanAlaska NativeAlaskan AthabascanAlbanianAleutAlsatianAmericanApacheArabArapahoArgentineanArmenianAssyrian/Chaldean/SyriacAustralianAustrianBahamianBangladeshiBarbadianBasqueBelgianBelizeanBermudanBhutaneseBlackfeetBolivianBrazilianBritishBritish West IndianBulgarianBurmeseCajunCambodianCanadianCape VerdeanCarpatho RusynCelticCentral AmericanCentral American IndianCherokeeCheyenneChickasawChileanChineseChippewaChoctawColombianColvilleComancheCosta RicanCreeCreekCroatianCrowCubanCypriotCzechCzechoslovakianDanishDelawareDominicanDutchDutch West IndianEastern EuropeanEcuadorianEgyptianEnglishEstonianEthiopianEuropeanFijianFilipinoFinnishFrenchFrench American IndianFrench CanadianGermanGerman RussianGhanaianGreekGuamanian/ChamorroGuatemalanGuyaneseHaitianHmongHonduranHopiHoumaHungarianIcelanderIndian (Asian)IndonesianInupiatIranianIraqiIrishIroquoisIsraeliItalianJamaicanJapaneseJordanianKenyanKiowaKoreanLaotianLatvianLebaneseLiberianLithuanianLumbeeLuxembourgerMacedonianMalaysianMalteseMarshalleseMenomineeMexicanMexican American IndianMongolianMoroccanNative HawaiianNavajoNepaleseNew ZealanderNicaraguanNigerianNorthern EuropeanNorwegianOkinawanOsageOttawaPaiutePakistaniPalestinianPanamanianParaguayanPennsylvania GermanPeruvianPimaPolishPortuguesePotawatomiPuebloPuerto RicanPuget Sound SalishRomanianRussianSalvadoranSamoanScandinavianScotch-IrishScottishSeminoleSenegaleseSerbianShoshoneSierra LeoneanSiouxSlavicSlovakSloveneSomaliSouth AfricanSouth AmericanSouth American IndianSoviet UnionSpaniardSpanishSpanish AmericanSpanish American IndianSri LankanSubsaharan AfricanSudaneseSwedishSwissSyrianTaiwaneseThaiTlingit-HaidaTohono O'OdhamTonganTrinidadian and TobagonianTsimshianTurkishU.S. Virgin IslanderUgandanUkrainianUruguayanUteVenezuelanVietnameseWelshWest IndianYakamaYaquiYugoslavianYumanYup'ikZimbabwean
Immigration
NonimmigrantsImmigrantsAfghanistanAfricaAlbaniaArgentinaArmeniaAsiaAustraliaAustriaBahamasBangladeshBarbadosBelarusBelgiumBelizeBoliviaBosnia and HerzegovinaBrazilBulgariaBurma/MyanmarCabo VerdeCambodiaCameroonCanadaCaribbeanCentral AmericaChileChinaColombiaCongoCosta RicaCroatiaCubaCzechoslovakiaDenmarkDominicaDominican RepublicEastern AfricaEastern AsiaEastern EuropeEgyptEl SalvadorEnglandEritreaEthiopiaEuropeFijiFranceGermanyGhanaGreeceGrenadaGuatemalaGuyanaHaitiHondurasHong KongHungaryIndiaIndonesiaIranIraqIrelandIsraelItalyJamaicaJapanJordanKazakhstanKenyaKoreaKuwaitLaosLatin AmericaLatviaLebanonLiberiaLithuaniaMalaysiaMexicoMicronesiaMiddle AfricaMoldovaMoroccoNepalNetherlandsNicaraguaNigeriaNorth AmericaNorth MacedoniaNorthern AfricaNorthern EuropeNorwayOceaniaPakistanPanamaPeruPhilippinesPolandPortugalRomaniaRussiaSaudi ArabiaScotlandSenegalSerbiaSierra LeoneSingaporeSomaliaSouth AfricaSouth AmericaSouth Central AsiaSouth Eastern AsiaSouthern EuropeSpainSri LankaSt. Vincent and the GrenadinesSudanSwedenSwitzerlandSyriaTaiwanThailandTrinidad and TobagoTurkeyUgandaUkraineUruguayUzbekistanVenezuelaVietnamWest IndiesWestern AfricaWestern AsiaWestern EuropeYemenZaireZimbabweAzores
Cognitive Disability
Income
Poverty
Unemployment
Labor Participation
Family Structure
Vehicle Availability
Education Level
Disability

Cognitive Disability Comparison

Immigrants from Ecuador

Costa Ricans

Good
Excellent
17.2%
COGNITIVE DISABILITY
64.4/ 100
METRIC RATING
166th/ 347
METRIC RANK
17.0%
COGNITIVE DISABILITY
88.0/ 100
METRIC RATING
146th/ 347
METRIC RANK

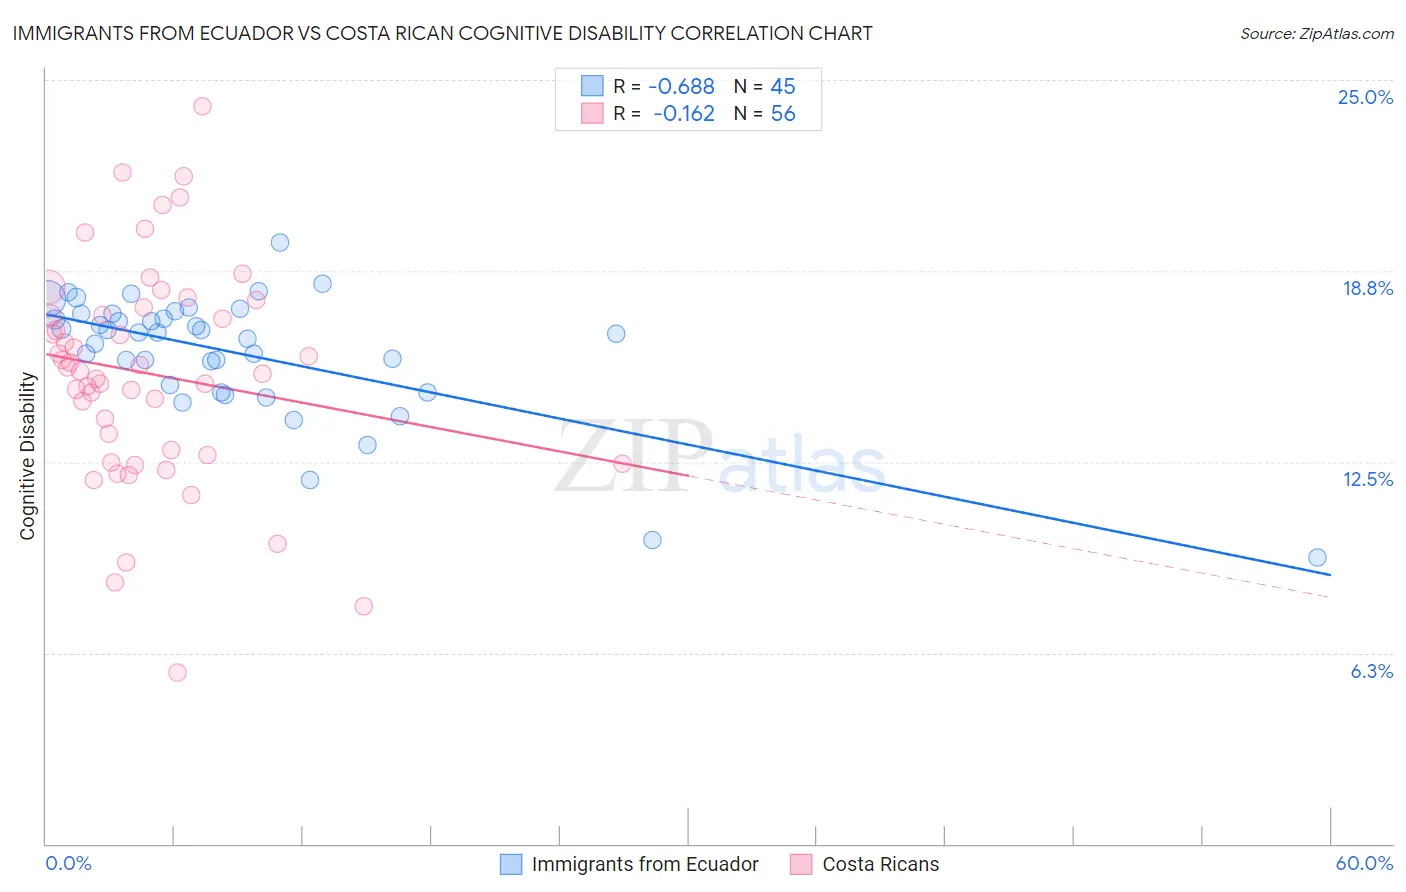
Immigrants from Ecuador vs Costa Rican Cognitive Disability Correlation Chart

The statistical analysis conducted on geographies consisting of 270,972,239 people shows a significant negative correlation between the proportion of Immigrants from Ecuador and percentage of population with cognitive disability in the United States with a correlation coefficient (R) of -0.688 and weighted average of 17.2%. Similarly, the statistical analysis conducted on geographies consisting of 253,564,903 people shows a poor negative correlation between the proportion of Costa Ricans and percentage of population with cognitive disability in the United States with a correlation coefficient (R) of -0.162 and weighted average of 17.0%, a difference of 1.0%.
Immigrants from Ecuador vs Costa Rican Cognitive Disability

Cognitive Disability Correlation Summary

MeasurementImmigrants from EcuadorCosta Rican
Minimum9.4%5.6%
Maximum19.7%24.1%
Range10.3%18.5%
Mean16.1%15.4%
Median16.7%15.5%
Interquartile 25% (IQ1)14.9%12.8%
Interquartile 75% (IQ3)17.3%17.4%
Interquartile Range (IQR)2.4%4.6%
Standard Deviation (Sample)2.0%3.6%
Standard Deviation (Population)2.0%3.6%

Demographics Similar to Immigrants from Ecuador and Costa Ricans by Cognitive Disability

In terms of cognitive disability, the demographic groups most similar to Immigrants from Ecuador are Immigrants from Albania (17.2%, a difference of 0.010%), Armenian (17.2%, a difference of 0.18%), Immigrants from Switzerland (17.2%, a difference of 0.23%), Yugoslavian (17.2%, a difference of 0.24%), and American (17.2%, a difference of 0.26%). Similarly, the demographic groups most similar to Costa Ricans are Scotch-Irish (17.1%, a difference of 0.13%), French Canadian (17.1%, a difference of 0.14%), Cypriot (17.1%, a difference of 0.14%), Basque (17.1%, a difference of 0.16%), and Syrian (17.1%, a difference of 0.29%).
DemographicsRating | RankCognitive Disability
Costa Ricans
88.0
/100
|
#146
Excellent
17.0%
Scotch-Irish
85.9
/100
|
#147
Excellent
17.1%
French Canadians
85.7
/100
|
#148
Excellent
17.1%
Cypriots
85.7
/100
|
#149
Excellent
17.1%
Basques
85.5
/100
|
#150
Excellent
17.1%
Syrians
83.0
/100
|
#151
Excellent
17.1%
Immigrants | Indonesia
82.7
/100
|
#152
Excellent
17.1%
Immigrants | Kazakhstan
80.5
/100
|
#153
Excellent
17.1%
Immigrants | Malaysia
79.3
/100
|
#154
Good
17.1%
Brazilians
78.9
/100
|
#155
Good
17.1%
Sri Lankans
78.9
/100
|
#156
Good
17.1%
Immigrants | Australia
76.0
/100
|
#157
Good
17.1%
Celtics
74.1
/100
|
#158
Good
17.1%
Immigrants | Latvia
73.2
/100
|
#159
Good
17.2%
Australians
72.4
/100
|
#160
Good
17.2%
Americans
72.2
/100
|
#161
Good
17.2%
Yugoslavians
71.6
/100
|
#162
Good
17.2%
Immigrants | Switzerland
71.5
/100
|
#163
Good
17.2%
Armenians
70.1
/100
|
#164
Good
17.2%
Immigrants | Albania
64.9
/100
|
#165
Good
17.2%
Immigrants | Ecuador
64.4
/100
|
#166
Good
17.2%