Immigrants from Ecuador vs Mexican Doctorate Degree
COMPARE
Immigrants from Ecuador
Mexican
Doctorate Degree
Doctorate Degree Comparison
Immigrants from Ecuador
Mexicans
1.4%
DOCTORATE DEGREE
0.2/ 100
METRIC RATING
296th/ 347
METRIC RANK
1.2%
DOCTORATE DEGREE
0.0/ 100
METRIC RATING
341st/ 347
METRIC RANK
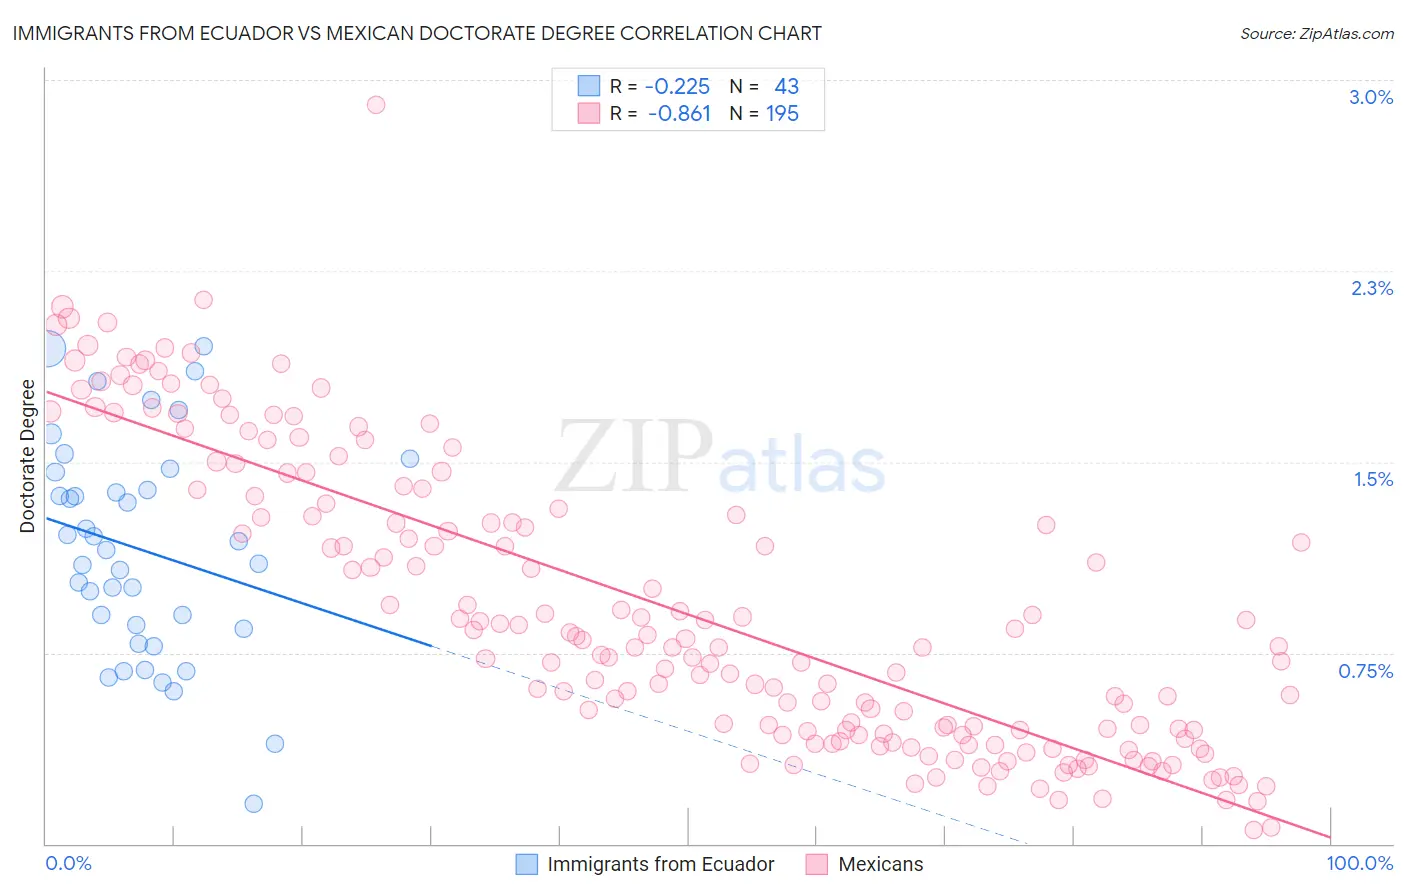
Immigrants from Ecuador vs Mexican Doctorate Degree Correlation Chart
The statistical analysis conducted on geographies consisting of 269,753,528 people shows a weak negative correlation between the proportion of Immigrants from Ecuador and percentage of population with at least doctorate degree education in the United States with a correlation coefficient (R) of -0.225 and weighted average of 1.4%. Similarly, the statistical analysis conducted on geographies consisting of 541,488,893 people shows a very strong negative correlation between the proportion of Mexicans and percentage of population with at least doctorate degree education in the United States with a correlation coefficient (R) of -0.861 and weighted average of 1.2%, a difference of 20.3%.
Doctorate Degree Correlation Summary
| Measurement | Immigrants from Ecuador | Mexican |
| Minimum | 0.16% | 0.054% |
| Maximum | 2.0% | 2.9% |
| Range | 1.8% | 2.8% |
| Mean | 1.2% | 0.92% |
| Median | 1.2% | 0.77% |
| Interquartile 25% (IQ1) | 0.84% | 0.43% |
| Interquartile 75% (IQ3) | 1.5% | 1.4% |
| Interquartile Range (IQR) | 0.62% | 0.94% |
| Standard Deviation (Sample) | 0.42% | 0.57% |
| Standard Deviation (Population) | 0.42% | 0.57% |
Similar Demographics by Doctorate Degree
Demographics Similar to Immigrants from Ecuador by Doctorate Degree
In terms of doctorate degree, the demographic groups most similar to Immigrants from Ecuador are Tsimshian (1.4%, a difference of 0.22%), Guatemalan (1.4%, a difference of 0.23%), Puerto Rican (1.4%, a difference of 0.63%), Samoan (1.4%, a difference of 0.94%), and Belizean (1.4%, a difference of 1.1%).
| Demographics | Rating | Rank | Doctorate Degree |
| Cape Verdeans | 0.3 /100 | #289 | Tragic 1.4% |
| Choctaw | 0.3 /100 | #290 | Tragic 1.4% |
| Blacks/African Americans | 0.3 /100 | #291 | Tragic 1.4% |
| Alaska Natives | 0.3 /100 | #292 | Tragic 1.4% |
| Immigrants | Yemen | 0.2 /100 | #293 | Tragic 1.4% |
| Samoans | 0.2 /100 | #294 | Tragic 1.4% |
| Guatemalans | 0.2 /100 | #295 | Tragic 1.4% |
| Immigrants | Ecuador | 0.2 /100 | #296 | Tragic 1.4% |
| Tsimshian | 0.2 /100 | #297 | Tragic 1.4% |
| Puerto Ricans | 0.1 /100 | #298 | Tragic 1.4% |
| Belizeans | 0.1 /100 | #299 | Tragic 1.4% |
| Immigrants | Guatemala | 0.1 /100 | #300 | Tragic 1.4% |
| Hondurans | 0.1 /100 | #301 | Tragic 1.4% |
| Shoshone | 0.1 /100 | #302 | Tragic 1.4% |
| Immigrants | Dominica | 0.1 /100 | #303 | Tragic 1.4% |
Demographics Similar to Mexicans by Doctorate Degree
In terms of doctorate degree, the demographic groups most similar to Mexicans are Arapaho (1.2%, a difference of 0.38%), Immigrants from Cuba (1.2%, a difference of 0.48%), Immigrants from Central America (1.2%, a difference of 1.3%), Puget Sound Salish (1.2%, a difference of 2.6%), and Bangladeshi (1.2%, a difference of 3.4%).
| Demographics | Rating | Rank | Doctorate Degree |
| Immigrants | Caribbean | 0.0 /100 | #333 | Tragic 1.3% |
| Immigrants | Dominican Republic | 0.0 /100 | #334 | Tragic 1.3% |
| Immigrants | Haiti | 0.0 /100 | #335 | Tragic 1.3% |
| Nepalese | 0.0 /100 | #336 | Tragic 1.3% |
| Bangladeshis | 0.0 /100 | #337 | Tragic 1.2% |
| Puget Sound Salish | 0.0 /100 | #338 | Tragic 1.2% |
| Immigrants | Central America | 0.0 /100 | #339 | Tragic 1.2% |
| Immigrants | Cuba | 0.0 /100 | #340 | Tragic 1.2% |
| Mexicans | 0.0 /100 | #341 | Tragic 1.2% |
| Arapaho | 0.0 /100 | #342 | Tragic 1.2% |
| Fijians | 0.0 /100 | #343 | Tragic 1.1% |
| Immigrants | Mexico | 0.0 /100 | #344 | Tragic 1.1% |
| Lumbee | 0.0 /100 | #345 | Tragic 1.1% |
| Spanish American Indians | 0.0 /100 | #346 | Tragic 1.1% |
| Houma | 0.0 /100 | #347 | Tragic 0.96% |