Immigrants from Ecuador vs Immigrants from the Azores Doctorate Degree
COMPARE
Immigrants from Ecuador
Immigrants from the Azores
Doctorate Degree
Doctorate Degree Comparison
Immigrants from Ecuador
Immigrants from the Azores
1.4%
DOCTORATE DEGREE
0.2/ 100
METRIC RATING
296th/ 347
METRIC RANK
1.4%
DOCTORATE DEGREE
0.1/ 100
METRIC RATING
315th/ 347
METRIC RANK
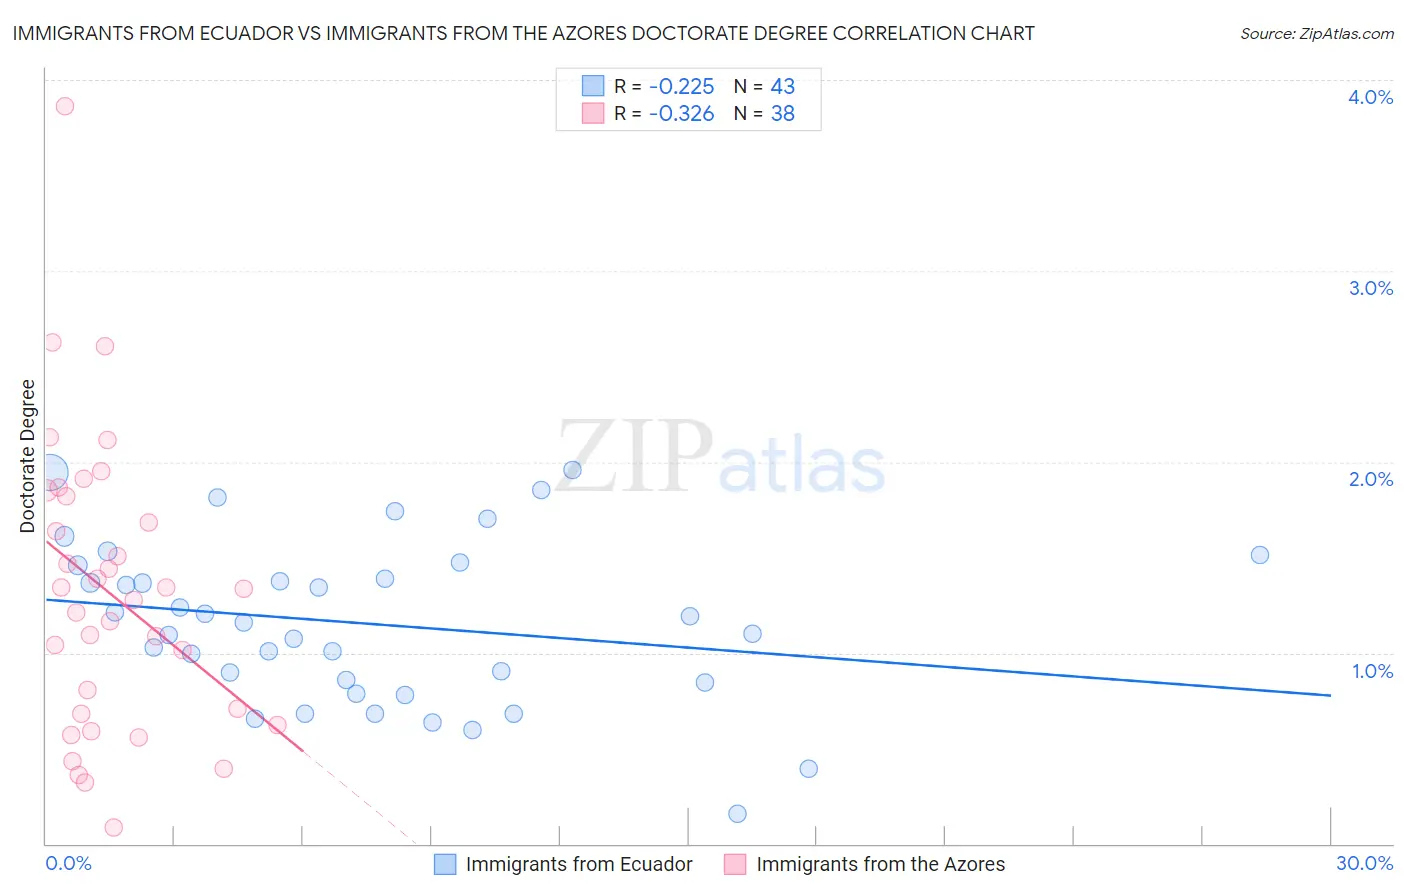
Immigrants from Ecuador vs Immigrants from the Azores Doctorate Degree Correlation Chart
The statistical analysis conducted on geographies consisting of 269,753,528 people shows a weak negative correlation between the proportion of Immigrants from Ecuador and percentage of population with at least doctorate degree education in the United States with a correlation coefficient (R) of -0.225 and weighted average of 1.4%. Similarly, the statistical analysis conducted on geographies consisting of 46,011,350 people shows a mild negative correlation between the proportion of Immigrants from the Azores and percentage of population with at least doctorate degree education in the United States with a correlation coefficient (R) of -0.326 and weighted average of 1.4%, a difference of 4.1%.
Doctorate Degree Correlation Summary
| Measurement | Immigrants from Ecuador | Immigrants from the Azores |
| Minimum | 0.16% | 0.085% |
| Maximum | 2.0% | 3.9% |
| Range | 1.8% | 3.8% |
| Mean | 1.2% | 1.3% |
| Median | 1.2% | 1.3% |
| Interquartile 25% (IQ1) | 0.84% | 0.68% |
| Interquartile 75% (IQ3) | 1.5% | 1.8% |
| Interquartile Range (IQR) | 0.62% | 1.1% |
| Standard Deviation (Sample) | 0.42% | 0.76% |
| Standard Deviation (Population) | 0.42% | 0.75% |
Demographics Similar to Immigrants from Ecuador and Immigrants from the Azores by Doctorate Degree
In terms of doctorate degree, the demographic groups most similar to Immigrants from Ecuador are Tsimshian (1.4%, a difference of 0.22%), Guatemalan (1.4%, a difference of 0.23%), Puerto Rican (1.4%, a difference of 0.63%), Belizean (1.4%, a difference of 1.1%), and Immigrants from Guatemala (1.4%, a difference of 1.4%). Similarly, the demographic groups most similar to Immigrants from the Azores are Dominican (1.4%, a difference of 0.020%), Menominee (1.4%, a difference of 0.10%), Immigrants from Nicaragua (1.4%, a difference of 0.42%), Immigrants from Honduras (1.4%, a difference of 0.79%), and Immigrants from Jamaica (1.4%, a difference of 0.97%).
| Demographics | Rating | Rank | Doctorate Degree |
| Guatemalans | 0.2 /100 | #295 | Tragic 1.4% |
| Immigrants | Ecuador | 0.2 /100 | #296 | Tragic 1.4% |
| Tsimshian | 0.2 /100 | #297 | Tragic 1.4% |
| Puerto Ricans | 0.1 /100 | #298 | Tragic 1.4% |
| Belizeans | 0.1 /100 | #299 | Tragic 1.4% |
| Immigrants | Guatemala | 0.1 /100 | #300 | Tragic 1.4% |
| Hondurans | 0.1 /100 | #301 | Tragic 1.4% |
| Shoshone | 0.1 /100 | #302 | Tragic 1.4% |
| Immigrants | Dominica | 0.1 /100 | #303 | Tragic 1.4% |
| Mexican American Indians | 0.1 /100 | #304 | Tragic 1.4% |
| Pennsylvania Germans | 0.1 /100 | #305 | Tragic 1.4% |
| Guyanese | 0.1 /100 | #306 | Tragic 1.4% |
| Cubans | 0.1 /100 | #307 | Tragic 1.4% |
| Immigrants | Laos | 0.1 /100 | #308 | Tragic 1.4% |
| Immigrants | Grenada | 0.1 /100 | #309 | Tragic 1.4% |
| Immigrants | Jamaica | 0.1 /100 | #310 | Tragic 1.4% |
| Immigrants | Honduras | 0.1 /100 | #311 | Tragic 1.4% |
| Immigrants | Nicaragua | 0.1 /100 | #312 | Tragic 1.4% |
| Menominee | 0.1 /100 | #313 | Tragic 1.4% |
| Dominicans | 0.1 /100 | #314 | Tragic 1.4% |
| Immigrants | Azores | 0.1 /100 | #315 | Tragic 1.4% |