Immigrants from Ecuador vs Alaskan Athabascan Master's Degree
COMPARE
Immigrants from Ecuador
Alaskan Athabascan
Master's Degree
Master's Degree Comparison
Immigrants from Ecuador
Alaskan Athabascans
13.6%
MASTER'S DEGREE
5.7/ 100
METRIC RATING
233rd/ 347
METRIC RANK
11.6%
MASTER'S DEGREE
0.1/ 100
METRIC RATING
296th/ 347
METRIC RANK
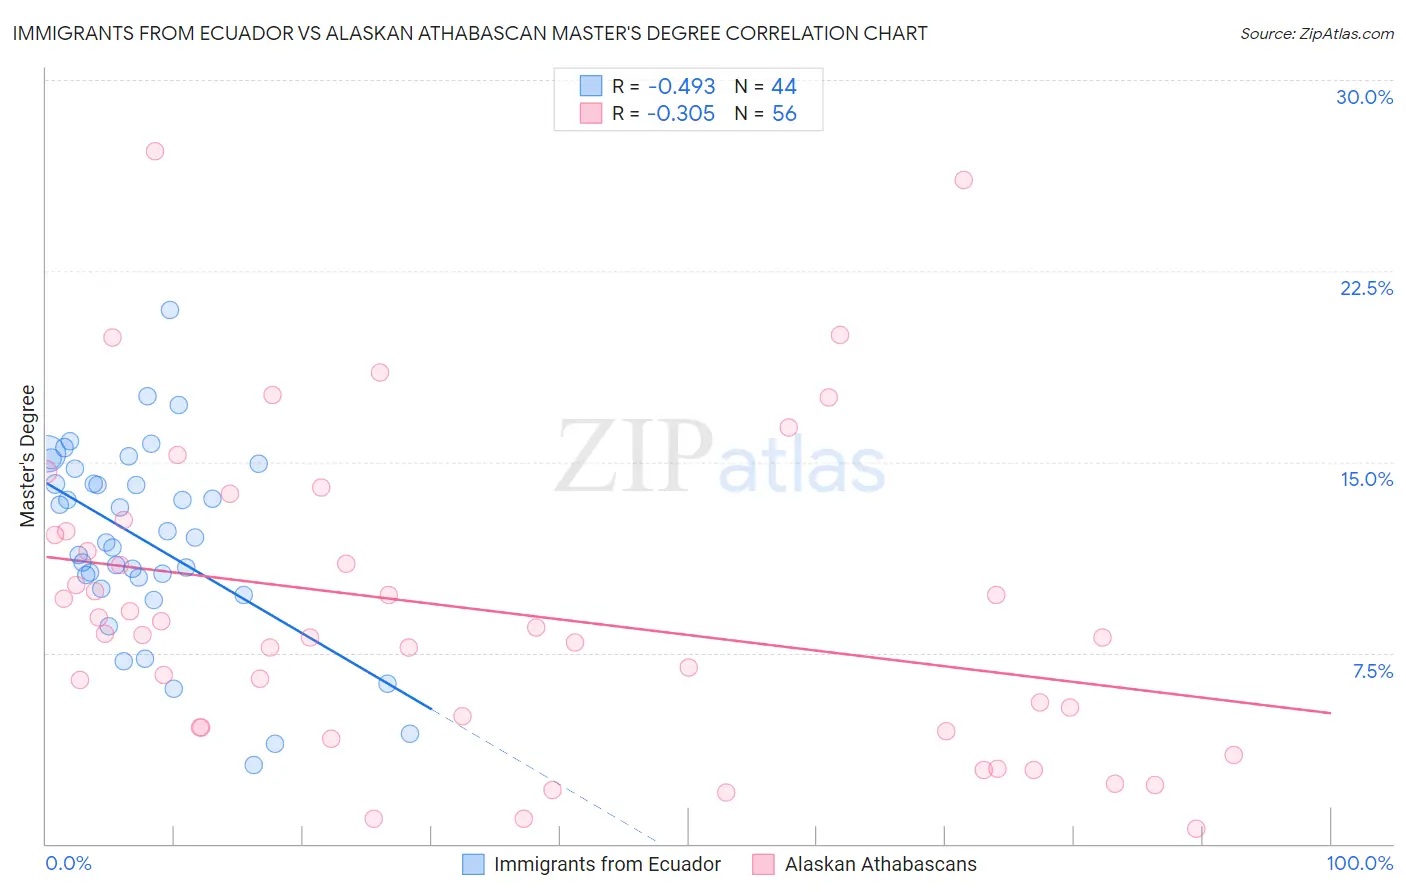
Immigrants from Ecuador vs Alaskan Athabascan Master's Degree Correlation Chart
The statistical analysis conducted on geographies consisting of 270,930,295 people shows a moderate negative correlation between the proportion of Immigrants from Ecuador and percentage of population with at least master's degree education in the United States with a correlation coefficient (R) of -0.493 and weighted average of 13.6%. Similarly, the statistical analysis conducted on geographies consisting of 45,807,187 people shows a mild negative correlation between the proportion of Alaskan Athabascans and percentage of population with at least master's degree education in the United States with a correlation coefficient (R) of -0.305 and weighted average of 11.6%, a difference of 17.4%.
Master's Degree Correlation Summary
| Measurement | Immigrants from Ecuador | Alaskan Athabascan |
| Minimum | 3.1% | 0.59% |
| Maximum | 21.0% | 27.2% |
| Range | 17.9% | 26.6% |
| Mean | 11.9% | 9.2% |
| Median | 11.9% | 8.2% |
| Interquartile 25% (IQ1) | 10.2% | 4.6% |
| Interquartile 75% (IQ3) | 14.4% | 12.2% |
| Interquartile Range (IQR) | 4.2% | 7.6% |
| Standard Deviation (Sample) | 3.8% | 6.0% |
| Standard Deviation (Population) | 3.7% | 6.0% |
Similar Demographics by Master's Degree
Demographics Similar to Immigrants from Ecuador by Master's Degree
In terms of master's degree, the demographic groups most similar to Immigrants from Ecuador are Immigrants from Philippines (13.6%, a difference of 0.15%), Immigrants from Burma/Myanmar (13.5%, a difference of 0.50%), German Russian (13.5%, a difference of 0.91%), Immigrants from Guyana (13.4%, a difference of 1.0%), and Guyanese (13.7%, a difference of 1.0%).
| Demographics | Rating | Rank | Master's Degree |
| Immigrants | St. Vincent and the Grenadines | 11.0 /100 | #226 | Poor 13.9% |
| Immigrants | West Indies | 9.8 /100 | #227 | Tragic 13.9% |
| Whites/Caucasians | 9.1 /100 | #228 | Tragic 13.8% |
| British West Indians | 8.8 /100 | #229 | Tragic 13.8% |
| Dutch | 8.7 /100 | #230 | Tragic 13.8% |
| Guyanese | 7.6 /100 | #231 | Tragic 13.7% |
| Immigrants | Philippines | 6.0 /100 | #232 | Tragic 13.6% |
| Immigrants | Ecuador | 5.7 /100 | #233 | Tragic 13.6% |
| Immigrants | Burma/Myanmar | 5.0 /100 | #234 | Tragic 13.5% |
| German Russians | 4.5 /100 | #235 | Tragic 13.5% |
| Immigrants | Guyana | 4.4 /100 | #236 | Tragic 13.4% |
| Jamaicans | 4.1 /100 | #237 | Tragic 13.4% |
| Hmong | 4.0 /100 | #238 | Tragic 13.4% |
| Immigrants | Nonimmigrants | 3.4 /100 | #239 | Tragic 13.3% |
| Guamanians/Chamorros | 2.2 /100 | #240 | Tragic 13.1% |
Demographics Similar to Alaskan Athabascans by Master's Degree
In terms of master's degree, the demographic groups most similar to Alaskan Athabascans are Marshallese (11.6%, a difference of 0.010%), Immigrants from Yemen (11.6%, a difference of 0.12%), Hawaiian (11.6%, a difference of 0.16%), Alaska Native (11.6%, a difference of 0.26%), and Immigrants from Guatemala (11.6%, a difference of 0.48%).
| Demographics | Rating | Rank | Master's Degree |
| Guatemalans | 0.1 /100 | #289 | Tragic 11.7% |
| Ute | 0.1 /100 | #290 | Tragic 11.7% |
| Colville | 0.1 /100 | #291 | Tragic 11.6% |
| Immigrants | Guatemala | 0.1 /100 | #292 | Tragic 11.6% |
| Alaska Natives | 0.1 /100 | #293 | Tragic 11.6% |
| Hawaiians | 0.1 /100 | #294 | Tragic 11.6% |
| Marshallese | 0.1 /100 | #295 | Tragic 11.6% |
| Alaskan Athabascans | 0.1 /100 | #296 | Tragic 11.6% |
| Immigrants | Yemen | 0.1 /100 | #297 | Tragic 11.6% |
| Samoans | 0.1 /100 | #298 | Tragic 11.5% |
| Chickasaw | 0.1 /100 | #299 | Tragic 11.4% |
| Chippewa | 0.1 /100 | #300 | Tragic 11.4% |
| Tsimshian | 0.1 /100 | #301 | Tragic 11.4% |
| Cherokee | 0.1 /100 | #302 | Tragic 11.4% |
| Immigrants | Laos | 0.1 /100 | #303 | Tragic 11.4% |