Delaware vs Alaskan Athabascan Master's Degree
COMPARE
Delaware
Alaskan Athabascan
Master's Degree
Master's Degree Comparison
Delaware
Alaskan Athabascans
13.0%
MASTER'S DEGREE
1.7/ 100
METRIC RATING
244th/ 347
METRIC RANK
11.6%
MASTER'S DEGREE
0.1/ 100
METRIC RATING
296th/ 347
METRIC RANK
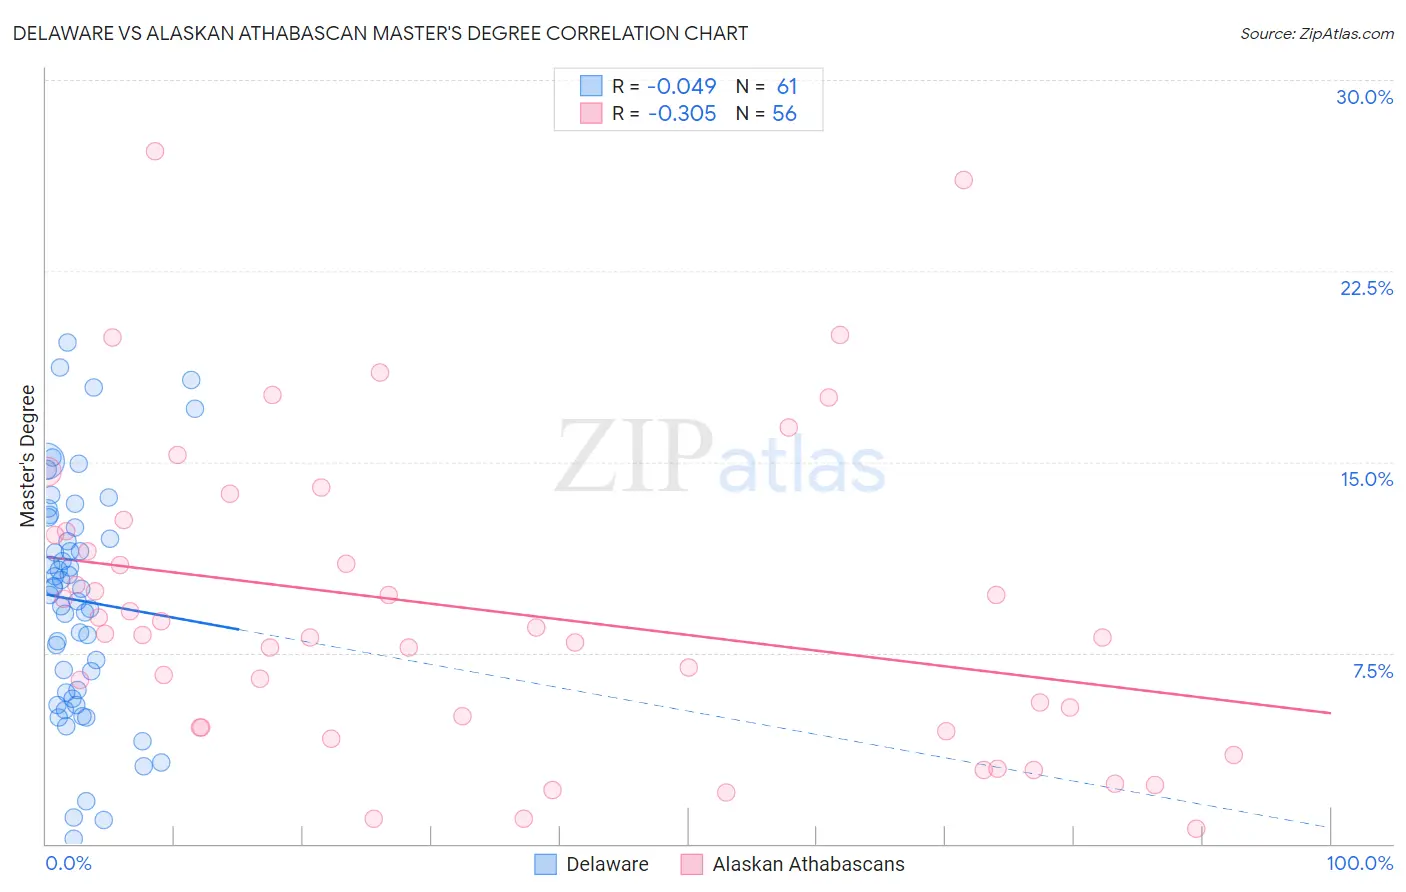
Delaware vs Alaskan Athabascan Master's Degree Correlation Chart
The statistical analysis conducted on geographies consisting of 96,222,112 people shows no correlation between the proportion of Delaware and percentage of population with at least master's degree education in the United States with a correlation coefficient (R) of -0.049 and weighted average of 13.0%. Similarly, the statistical analysis conducted on geographies consisting of 45,807,187 people shows a mild negative correlation between the proportion of Alaskan Athabascans and percentage of population with at least master's degree education in the United States with a correlation coefficient (R) of -0.305 and weighted average of 11.6%, a difference of 12.3%.
Master's Degree Correlation Summary
| Measurement | Delaware | Alaskan Athabascan |
| Minimum | 0.20% | 0.59% |
| Maximum | 19.7% | 27.2% |
| Range | 19.5% | 26.6% |
| Mean | 9.6% | 9.2% |
| Median | 10.0% | 8.2% |
| Interquartile 25% (IQ1) | 5.8% | 4.6% |
| Interquartile 75% (IQ3) | 12.6% | 12.2% |
| Interquartile Range (IQR) | 6.8% | 7.6% |
| Standard Deviation (Sample) | 4.6% | 6.0% |
| Standard Deviation (Population) | 4.5% | 6.0% |
Similar Demographics by Master's Degree
Demographics Similar to Delaware by Master's Degree
In terms of master's degree, the demographic groups most similar to Delaware are Immigrants from Jamaica (13.0%, a difference of 0.38%), Spanish American (13.0%, a difference of 0.42%), Immigrants from Bahamas (12.9%, a difference of 0.66%), U.S. Virgin Islander (13.1%, a difference of 0.70%), and Immigrants from Cambodia (12.9%, a difference of 0.70%).
| Demographics | Rating | Rank | Master's Degree |
| Jamaicans | 4.1 /100 | #237 | Tragic 13.4% |
| Hmong | 4.0 /100 | #238 | Tragic 13.4% |
| Immigrants | Nonimmigrants | 3.4 /100 | #239 | Tragic 13.3% |
| Guamanians/Chamorros | 2.2 /100 | #240 | Tragic 13.1% |
| U.S. Virgin Islanders | 2.1 /100 | #241 | Tragic 13.1% |
| Spanish Americans | 1.9 /100 | #242 | Tragic 13.0% |
| Immigrants | Jamaica | 1.9 /100 | #243 | Tragic 13.0% |
| Delaware | 1.7 /100 | #244 | Tragic 13.0% |
| Immigrants | Bahamas | 1.4 /100 | #245 | Tragic 12.9% |
| Immigrants | Cambodia | 1.4 /100 | #246 | Tragic 12.9% |
| Iroquois | 1.4 /100 | #247 | Tragic 12.9% |
| Africans | 1.4 /100 | #248 | Tragic 12.9% |
| Cree | 1.3 /100 | #249 | Tragic 12.8% |
| Liberians | 1.3 /100 | #250 | Tragic 12.8% |
| Tlingit-Haida | 1.3 /100 | #251 | Tragic 12.8% |
Demographics Similar to Alaskan Athabascans by Master's Degree
In terms of master's degree, the demographic groups most similar to Alaskan Athabascans are Marshallese (11.6%, a difference of 0.010%), Immigrants from Yemen (11.6%, a difference of 0.12%), Hawaiian (11.6%, a difference of 0.16%), Alaska Native (11.6%, a difference of 0.26%), and Immigrants from Guatemala (11.6%, a difference of 0.48%).
| Demographics | Rating | Rank | Master's Degree |
| Guatemalans | 0.1 /100 | #289 | Tragic 11.7% |
| Ute | 0.1 /100 | #290 | Tragic 11.7% |
| Colville | 0.1 /100 | #291 | Tragic 11.6% |
| Immigrants | Guatemala | 0.1 /100 | #292 | Tragic 11.6% |
| Alaska Natives | 0.1 /100 | #293 | Tragic 11.6% |
| Hawaiians | 0.1 /100 | #294 | Tragic 11.6% |
| Marshallese | 0.1 /100 | #295 | Tragic 11.6% |
| Alaskan Athabascans | 0.1 /100 | #296 | Tragic 11.6% |
| Immigrants | Yemen | 0.1 /100 | #297 | Tragic 11.6% |
| Samoans | 0.1 /100 | #298 | Tragic 11.5% |
| Chickasaw | 0.1 /100 | #299 | Tragic 11.4% |
| Chippewa | 0.1 /100 | #300 | Tragic 11.4% |
| Tsimshian | 0.1 /100 | #301 | Tragic 11.4% |
| Cherokee | 0.1 /100 | #302 | Tragic 11.4% |
| Immigrants | Laos | 0.1 /100 | #303 | Tragic 11.4% |