Immigrants from Ecuador vs Finnish Master's Degree
COMPARE
Immigrants from Ecuador
Finnish
Master's Degree
Master's Degree Comparison
Immigrants from Ecuador
Finns
13.6%
MASTER'S DEGREE
5.7/ 100
METRIC RATING
233rd/ 347
METRIC RANK
14.2%
MASTER'S DEGREE
16.9/ 100
METRIC RATING
214th/ 347
METRIC RANK
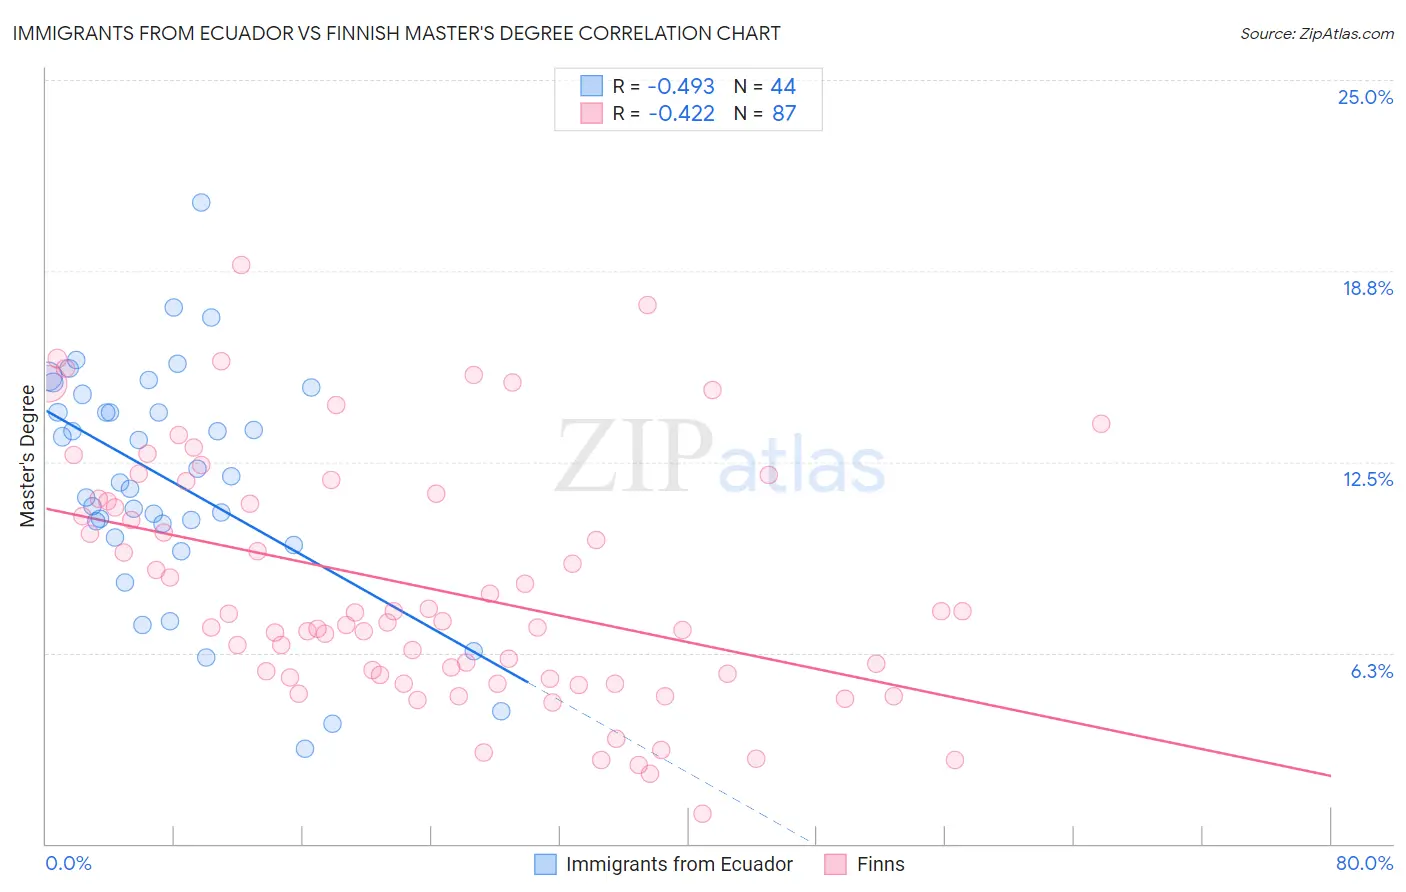
Immigrants from Ecuador vs Finnish Master's Degree Correlation Chart
The statistical analysis conducted on geographies consisting of 270,930,295 people shows a moderate negative correlation between the proportion of Immigrants from Ecuador and percentage of population with at least master's degree education in the United States with a correlation coefficient (R) of -0.493 and weighted average of 13.6%. Similarly, the statistical analysis conducted on geographies consisting of 404,580,183 people shows a moderate negative correlation between the proportion of Finns and percentage of population with at least master's degree education in the United States with a correlation coefficient (R) of -0.422 and weighted average of 14.2%, a difference of 4.3%.
Master's Degree Correlation Summary
| Measurement | Immigrants from Ecuador | Finnish |
| Minimum | 3.1% | 1.0% |
| Maximum | 21.0% | 18.9% |
| Range | 17.9% | 17.9% |
| Mean | 11.9% | 8.4% |
| Median | 11.9% | 7.3% |
| Interquartile 25% (IQ1) | 10.2% | 5.4% |
| Interquartile 75% (IQ3) | 14.4% | 11.3% |
| Interquartile Range (IQR) | 4.2% | 5.8% |
| Standard Deviation (Sample) | 3.8% | 4.0% |
| Standard Deviation (Population) | 3.7% | 4.0% |
Demographics Similar to Immigrants from Ecuador and Finns by Master's Degree
In terms of master's degree, the demographic groups most similar to Immigrants from Ecuador are Immigrants from Philippines (13.6%, a difference of 0.15%), Guyanese (13.7%, a difference of 1.0%), Dutch (13.8%, a difference of 1.6%), British West Indian (13.8%, a difference of 1.6%), and White/Caucasian (13.8%, a difference of 1.7%). Similarly, the demographic groups most similar to Finns are Immigrants from Thailand (14.2%, a difference of 0.010%), Immigrants from Vietnam (14.1%, a difference of 0.21%), Immigrants from Somalia (14.1%, a difference of 0.27%), Immigrants from Trinidad and Tobago (14.1%, a difference of 0.28%), and French Canadian (14.1%, a difference of 0.52%).
| Demographics | Rating | Rank | Master's Degree |
| Immigrants | Thailand | 17.0 /100 | #213 | Poor 14.2% |
| Finns | 16.9 /100 | #214 | Poor 14.2% |
| Immigrants | Vietnam | 16.1 /100 | #215 | Poor 14.1% |
| Immigrants | Somalia | 15.8 /100 | #216 | Poor 14.1% |
| Immigrants | Trinidad and Tobago | 15.8 /100 | #217 | Poor 14.1% |
| French Canadians | 14.9 /100 | #218 | Poor 14.1% |
| Norwegians | 13.6 /100 | #219 | Poor 14.0% |
| Germans | 13.1 /100 | #220 | Poor 14.0% |
| Koreans | 12.7 /100 | #221 | Poor 14.0% |
| Ecuadorians | 12.6 /100 | #222 | Poor 14.0% |
| Immigrants | South Eastern Asia | 11.9 /100 | #223 | Poor 14.0% |
| Immigrants | Grenada | 11.8 /100 | #224 | Poor 14.0% |
| Portuguese | 11.2 /100 | #225 | Poor 13.9% |
| Immigrants | St. Vincent and the Grenadines | 11.0 /100 | #226 | Poor 13.9% |
| Immigrants | West Indies | 9.8 /100 | #227 | Tragic 13.9% |
| Whites/Caucasians | 9.1 /100 | #228 | Tragic 13.8% |
| British West Indians | 8.8 /100 | #229 | Tragic 13.8% |
| Dutch | 8.7 /100 | #230 | Tragic 13.8% |
| Guyanese | 7.6 /100 | #231 | Tragic 13.7% |
| Immigrants | Philippines | 6.0 /100 | #232 | Tragic 13.6% |
| Immigrants | Ecuador | 5.7 /100 | #233 | Tragic 13.6% |