Immigrants from Ecuador vs Egyptian Master's Degree
COMPARE
Immigrants from Ecuador
Egyptian
Master's Degree
Master's Degree Comparison
Immigrants from Ecuador
Egyptians
13.6%
MASTER'S DEGREE
5.7/ 100
METRIC RATING
233rd/ 347
METRIC RANK
17.6%
MASTER'S DEGREE
99.6/ 100
METRIC RATING
75th/ 347
METRIC RANK
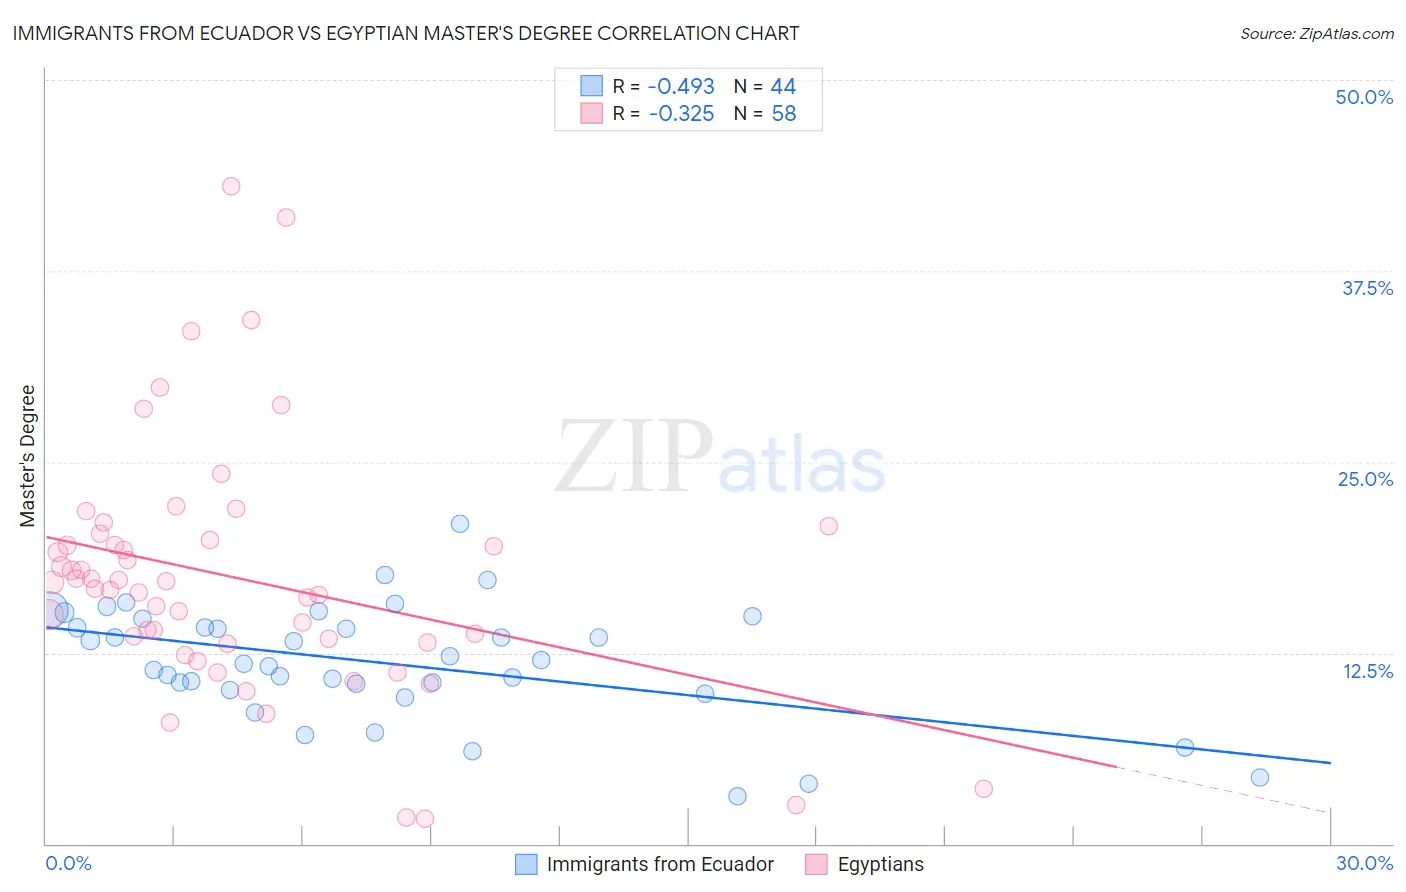
Immigrants from Ecuador vs Egyptian Master's Degree Correlation Chart
The statistical analysis conducted on geographies consisting of 270,930,295 people shows a moderate negative correlation between the proportion of Immigrants from Ecuador and percentage of population with at least master's degree education in the United States with a correlation coefficient (R) of -0.493 and weighted average of 13.6%. Similarly, the statistical analysis conducted on geographies consisting of 276,863,578 people shows a mild negative correlation between the proportion of Egyptians and percentage of population with at least master's degree education in the United States with a correlation coefficient (R) of -0.325 and weighted average of 17.6%, a difference of 29.6%.
Master's Degree Correlation Summary
| Measurement | Immigrants from Ecuador | Egyptian |
| Minimum | 3.1% | 1.6% |
| Maximum | 21.0% | 43.1% |
| Range | 17.9% | 41.4% |
| Mean | 11.9% | 17.4% |
| Median | 11.9% | 16.9% |
| Interquartile 25% (IQ1) | 10.2% | 13.2% |
| Interquartile 75% (IQ3) | 14.4% | 19.9% |
| Interquartile Range (IQR) | 4.2% | 6.7% |
| Standard Deviation (Sample) | 3.8% | 8.2% |
| Standard Deviation (Population) | 3.7% | 8.1% |
Similar Demographics by Master's Degree
Demographics Similar to Immigrants from Ecuador by Master's Degree
In terms of master's degree, the demographic groups most similar to Immigrants from Ecuador are Immigrants from Philippines (13.6%, a difference of 0.15%), Immigrants from Burma/Myanmar (13.5%, a difference of 0.50%), German Russian (13.5%, a difference of 0.91%), Immigrants from Guyana (13.4%, a difference of 1.0%), and Guyanese (13.7%, a difference of 1.0%).
| Demographics | Rating | Rank | Master's Degree |
| Immigrants | St. Vincent and the Grenadines | 11.0 /100 | #226 | Poor 13.9% |
| Immigrants | West Indies | 9.8 /100 | #227 | Tragic 13.9% |
| Whites/Caucasians | 9.1 /100 | #228 | Tragic 13.8% |
| British West Indians | 8.8 /100 | #229 | Tragic 13.8% |
| Dutch | 8.7 /100 | #230 | Tragic 13.8% |
| Guyanese | 7.6 /100 | #231 | Tragic 13.7% |
| Immigrants | Philippines | 6.0 /100 | #232 | Tragic 13.6% |
| Immigrants | Ecuador | 5.7 /100 | #233 | Tragic 13.6% |
| Immigrants | Burma/Myanmar | 5.0 /100 | #234 | Tragic 13.5% |
| German Russians | 4.5 /100 | #235 | Tragic 13.5% |
| Immigrants | Guyana | 4.4 /100 | #236 | Tragic 13.4% |
| Jamaicans | 4.1 /100 | #237 | Tragic 13.4% |
| Hmong | 4.0 /100 | #238 | Tragic 13.4% |
| Immigrants | Nonimmigrants | 3.4 /100 | #239 | Tragic 13.3% |
| Guamanians/Chamorros | 2.2 /100 | #240 | Tragic 13.1% |
Demographics Similar to Egyptians by Master's Degree
In terms of master's degree, the demographic groups most similar to Egyptians are Immigrants from Indonesia (17.6%, a difference of 0.030%), Immigrants from Eastern Europe (17.6%, a difference of 0.14%), Immigrants from Hungary (17.5%, a difference of 0.34%), Immigrants from Romania (17.7%, a difference of 0.38%), and Immigrants from Lebanon (17.5%, a difference of 0.47%).
| Demographics | Rating | Rank | Master's Degree |
| Immigrants | Ethiopia | 99.8 /100 | #68 | Exceptional 17.9% |
| Immigrants | Uzbekistan | 99.8 /100 | #69 | Exceptional 17.9% |
| Immigrants | Western Europe | 99.8 /100 | #70 | Exceptional 17.8% |
| Immigrants | Pakistan | 99.7 /100 | #71 | Exceptional 17.8% |
| Lithuanians | 99.7 /100 | #72 | Exceptional 17.7% |
| Zimbabweans | 99.7 /100 | #73 | Exceptional 17.7% |
| Immigrants | Romania | 99.7 /100 | #74 | Exceptional 17.7% |
| Egyptians | 99.6 /100 | #75 | Exceptional 17.6% |
| Immigrants | Indonesia | 99.6 /100 | #76 | Exceptional 17.6% |
| Immigrants | Eastern Europe | 99.6 /100 | #77 | Exceptional 17.6% |
| Immigrants | Hungary | 99.6 /100 | #78 | Exceptional 17.5% |
| Immigrants | Lebanon | 99.6 /100 | #79 | Exceptional 17.5% |
| Carpatho Rusyns | 99.6 /100 | #80 | Exceptional 17.5% |
| Immigrants | Western Asia | 99.5 /100 | #81 | Exceptional 17.5% |
| Greeks | 99.5 /100 | #82 | Exceptional 17.5% |