Black/African American vs Alaskan Athabascan Master's Degree
COMPARE
Black/African American
Alaskan Athabascan
Master's Degree
Master's Degree Comparison
Blacks/African Americans
Alaskan Athabascans
12.1%
MASTER'S DEGREE
0.3/ 100
METRIC RATING
276th/ 347
METRIC RANK
11.6%
MASTER'S DEGREE
0.1/ 100
METRIC RATING
296th/ 347
METRIC RANK
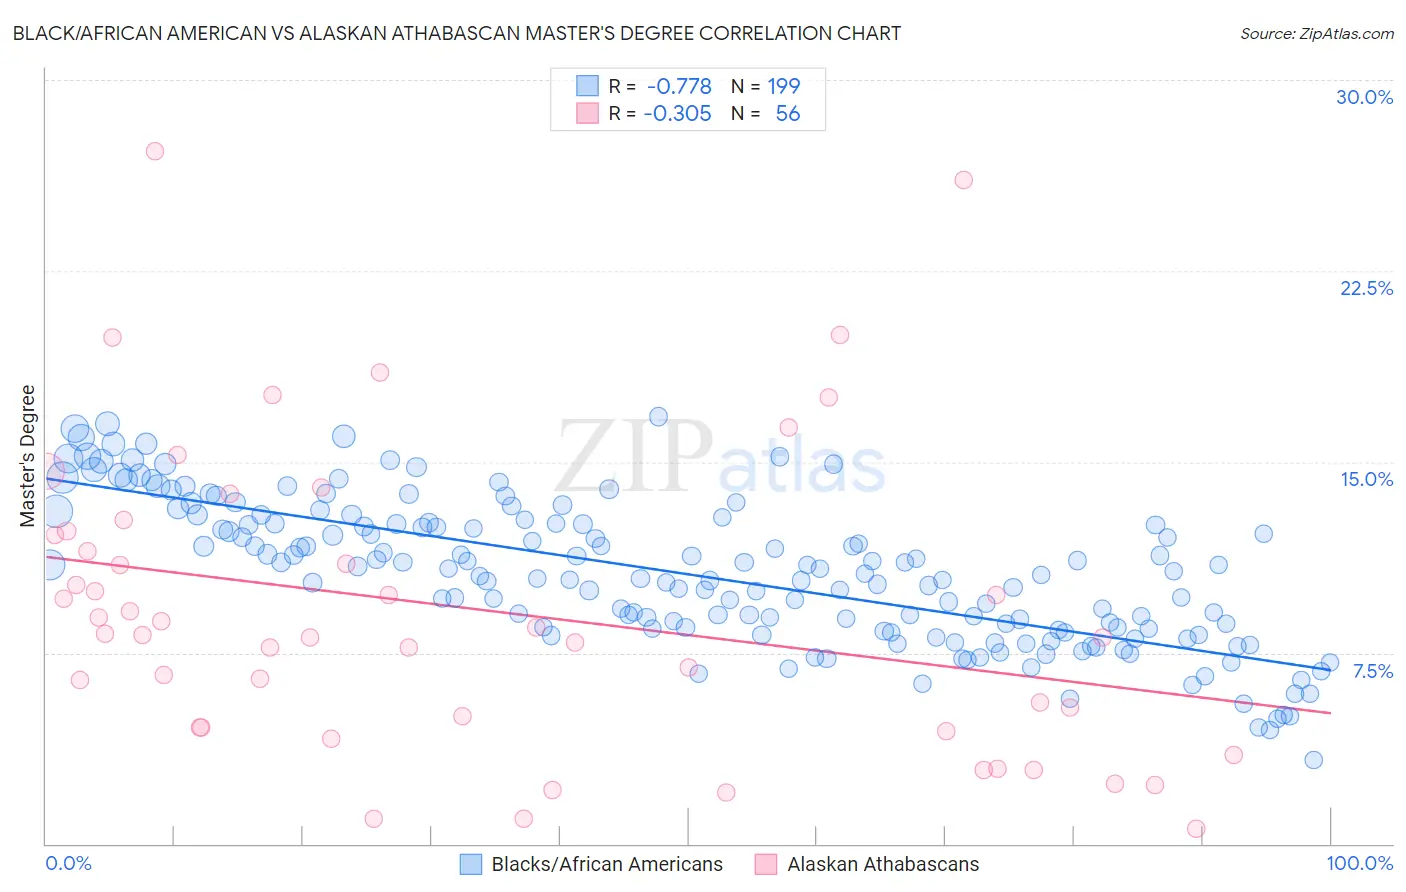
Black/African American vs Alaskan Athabascan Master's Degree Correlation Chart
The statistical analysis conducted on geographies consisting of 563,961,779 people shows a strong negative correlation between the proportion of Blacks/African Americans and percentage of population with at least master's degree education in the United States with a correlation coefficient (R) of -0.778 and weighted average of 12.1%. Similarly, the statistical analysis conducted on geographies consisting of 45,807,187 people shows a mild negative correlation between the proportion of Alaskan Athabascans and percentage of population with at least master's degree education in the United States with a correlation coefficient (R) of -0.305 and weighted average of 11.6%, a difference of 4.3%.
Master's Degree Correlation Summary
| Measurement | Black/African American | Alaskan Athabascan |
| Minimum | 3.3% | 0.59% |
| Maximum | 16.8% | 27.2% |
| Range | 13.5% | 26.6% |
| Mean | 10.6% | 9.2% |
| Median | 10.6% | 8.2% |
| Interquartile 25% (IQ1) | 8.4% | 4.6% |
| Interquartile 75% (IQ3) | 12.6% | 12.2% |
| Interquartile Range (IQR) | 4.1% | 7.6% |
| Standard Deviation (Sample) | 2.8% | 6.0% |
| Standard Deviation (Population) | 2.8% | 6.0% |
Demographics Similar to Blacks/African Americans and Alaskan Athabascans by Master's Degree
In terms of master's degree, the demographic groups most similar to Blacks/African Americans are Immigrants from Caribbean (12.1%, a difference of 0.010%), Potawatomi (12.1%, a difference of 0.010%), Immigrants from Belize (12.1%, a difference of 0.090%), Immigrants from Dominican Republic (12.1%, a difference of 0.15%), and Malaysian (12.0%, a difference of 0.27%). Similarly, the demographic groups most similar to Alaskan Athabascans are Marshallese (11.6%, a difference of 0.010%), Hawaiian (11.6%, a difference of 0.16%), Alaska Native (11.6%, a difference of 0.26%), Immigrants from Guatemala (11.6%, a difference of 0.48%), and Colville (11.6%, a difference of 0.61%).
| Demographics | Rating | Rank | Master's Degree |
| Blacks/African Americans | 0.3 /100 | #276 | Tragic 12.1% |
| Immigrants | Caribbean | 0.3 /100 | #277 | Tragic 12.1% |
| Potawatomi | 0.3 /100 | #278 | Tragic 12.1% |
| Immigrants | Belize | 0.2 /100 | #279 | Tragic 12.1% |
| Immigrants | Dominican Republic | 0.2 /100 | #280 | Tragic 12.1% |
| Malaysians | 0.2 /100 | #281 | Tragic 12.0% |
| Immigrants | El Salvador | 0.2 /100 | #282 | Tragic 12.0% |
| Hondurans | 0.2 /100 | #283 | Tragic 11.9% |
| Ottawa | 0.2 /100 | #284 | Tragic 11.9% |
| Immigrants | Nicaragua | 0.2 /100 | #285 | Tragic 11.8% |
| Aleuts | 0.1 /100 | #286 | Tragic 11.8% |
| Immigrants | Haiti | 0.1 /100 | #287 | Tragic 11.8% |
| Immigrants | Honduras | 0.1 /100 | #288 | Tragic 11.8% |
| Guatemalans | 0.1 /100 | #289 | Tragic 11.7% |
| Ute | 0.1 /100 | #290 | Tragic 11.7% |
| Colville | 0.1 /100 | #291 | Tragic 11.6% |
| Immigrants | Guatemala | 0.1 /100 | #292 | Tragic 11.6% |
| Alaska Natives | 0.1 /100 | #293 | Tragic 11.6% |
| Hawaiians | 0.1 /100 | #294 | Tragic 11.6% |
| Marshallese | 0.1 /100 | #295 | Tragic 11.6% |
| Alaskan Athabascans | 0.1 /100 | #296 | Tragic 11.6% |