Immigrants from Sri Lanka vs Alaskan Athabascan Master's Degree
COMPARE
Immigrants from Sri Lanka
Alaskan Athabascan
Master's Degree
Master's Degree Comparison
Immigrants from Sri Lanka
Alaskan Athabascans
19.9%
MASTER'S DEGREE
100.0/ 100
METRIC RATING
27th/ 347
METRIC RANK
11.6%
MASTER'S DEGREE
0.1/ 100
METRIC RATING
296th/ 347
METRIC RANK
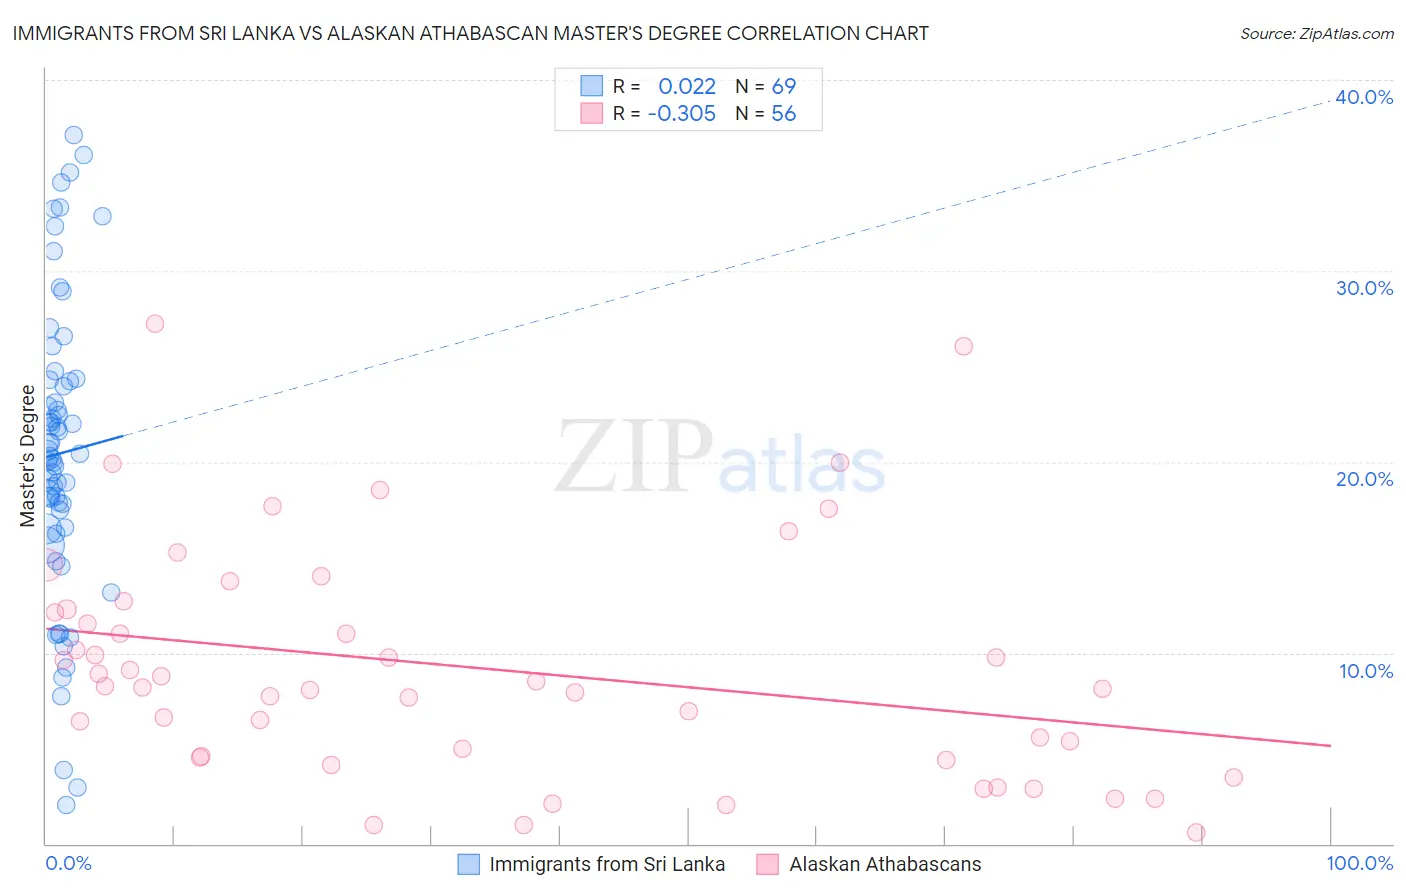
Immigrants from Sri Lanka vs Alaskan Athabascan Master's Degree Correlation Chart
The statistical analysis conducted on geographies consisting of 149,694,773 people shows no correlation between the proportion of Immigrants from Sri Lanka and percentage of population with at least master's degree education in the United States with a correlation coefficient (R) of 0.022 and weighted average of 19.9%. Similarly, the statistical analysis conducted on geographies consisting of 45,807,187 people shows a mild negative correlation between the proportion of Alaskan Athabascans and percentage of population with at least master's degree education in the United States with a correlation coefficient (R) of -0.305 and weighted average of 11.6%, a difference of 72.1%.
Master's Degree Correlation Summary
| Measurement | Immigrants from Sri Lanka | Alaskan Athabascan |
| Minimum | 2.0% | 0.59% |
| Maximum | 37.1% | 27.2% |
| Range | 35.1% | 26.6% |
| Mean | 20.4% | 9.2% |
| Median | 20.3% | 8.2% |
| Interquartile 25% (IQ1) | 16.5% | 4.6% |
| Interquartile 75% (IQ3) | 24.3% | 12.2% |
| Interquartile Range (IQR) | 7.7% | 7.6% |
| Standard Deviation (Sample) | 7.8% | 6.0% |
| Standard Deviation (Population) | 7.7% | 6.0% |
Similar Demographics by Master's Degree
Demographics Similar to Immigrants from Sri Lanka by Master's Degree
In terms of master's degree, the demographic groups most similar to Immigrants from Sri Lanka are Turkish (19.9%, a difference of 0.070%), Cambodian (20.0%, a difference of 0.41%), Latvian (19.8%, a difference of 0.48%), Immigrants from Japan (20.0%, a difference of 0.51%), and Immigrants from Turkey (19.7%, a difference of 0.99%).
| Demographics | Rating | Rank | Master's Degree |
| Indians (Asian) | 100.0 /100 | #20 | Exceptional 20.5% |
| Immigrants | Ireland | 100.0 /100 | #21 | Exceptional 20.4% |
| Israelis | 100.0 /100 | #22 | Exceptional 20.3% |
| Immigrants | France | 100.0 /100 | #23 | Exceptional 20.3% |
| Immigrants | Sweden | 100.0 /100 | #24 | Exceptional 20.3% |
| Immigrants | Japan | 100.0 /100 | #25 | Exceptional 20.0% |
| Cambodians | 100.0 /100 | #26 | Exceptional 20.0% |
| Immigrants | Sri Lanka | 100.0 /100 | #27 | Exceptional 19.9% |
| Turks | 100.0 /100 | #28 | Exceptional 19.9% |
| Latvians | 100.0 /100 | #29 | Exceptional 19.8% |
| Immigrants | Turkey | 100.0 /100 | #30 | Exceptional 19.7% |
| Immigrants | Korea | 100.0 /100 | #31 | Exceptional 19.7% |
| Burmese | 100.0 /100 | #32 | Exceptional 19.7% |
| Russians | 100.0 /100 | #33 | Exceptional 19.5% |
| Immigrants | Denmark | 100.0 /100 | #34 | Exceptional 19.5% |
Demographics Similar to Alaskan Athabascans by Master's Degree
In terms of master's degree, the demographic groups most similar to Alaskan Athabascans are Marshallese (11.6%, a difference of 0.010%), Immigrants from Yemen (11.6%, a difference of 0.12%), Hawaiian (11.6%, a difference of 0.16%), Alaska Native (11.6%, a difference of 0.26%), and Immigrants from Guatemala (11.6%, a difference of 0.48%).
| Demographics | Rating | Rank | Master's Degree |
| Guatemalans | 0.1 /100 | #289 | Tragic 11.7% |
| Ute | 0.1 /100 | #290 | Tragic 11.7% |
| Colville | 0.1 /100 | #291 | Tragic 11.6% |
| Immigrants | Guatemala | 0.1 /100 | #292 | Tragic 11.6% |
| Alaska Natives | 0.1 /100 | #293 | Tragic 11.6% |
| Hawaiians | 0.1 /100 | #294 | Tragic 11.6% |
| Marshallese | 0.1 /100 | #295 | Tragic 11.6% |
| Alaskan Athabascans | 0.1 /100 | #296 | Tragic 11.6% |
| Immigrants | Yemen | 0.1 /100 | #297 | Tragic 11.6% |
| Samoans | 0.1 /100 | #298 | Tragic 11.5% |
| Chickasaw | 0.1 /100 | #299 | Tragic 11.4% |
| Chippewa | 0.1 /100 | #300 | Tragic 11.4% |
| Tsimshian | 0.1 /100 | #301 | Tragic 11.4% |
| Cherokee | 0.1 /100 | #302 | Tragic 11.4% |
| Immigrants | Laos | 0.1 /100 | #303 | Tragic 11.4% |