Immigrants from Ecuador vs Russian Master's Degree
COMPARE
Immigrants from Ecuador
Russian
Master's Degree
Master's Degree Comparison
Immigrants from Ecuador
Russians
13.6%
MASTER'S DEGREE
5.7/ 100
METRIC RATING
233rd/ 347
METRIC RANK
19.5%
MASTER'S DEGREE
100.0/ 100
METRIC RATING
33rd/ 347
METRIC RANK
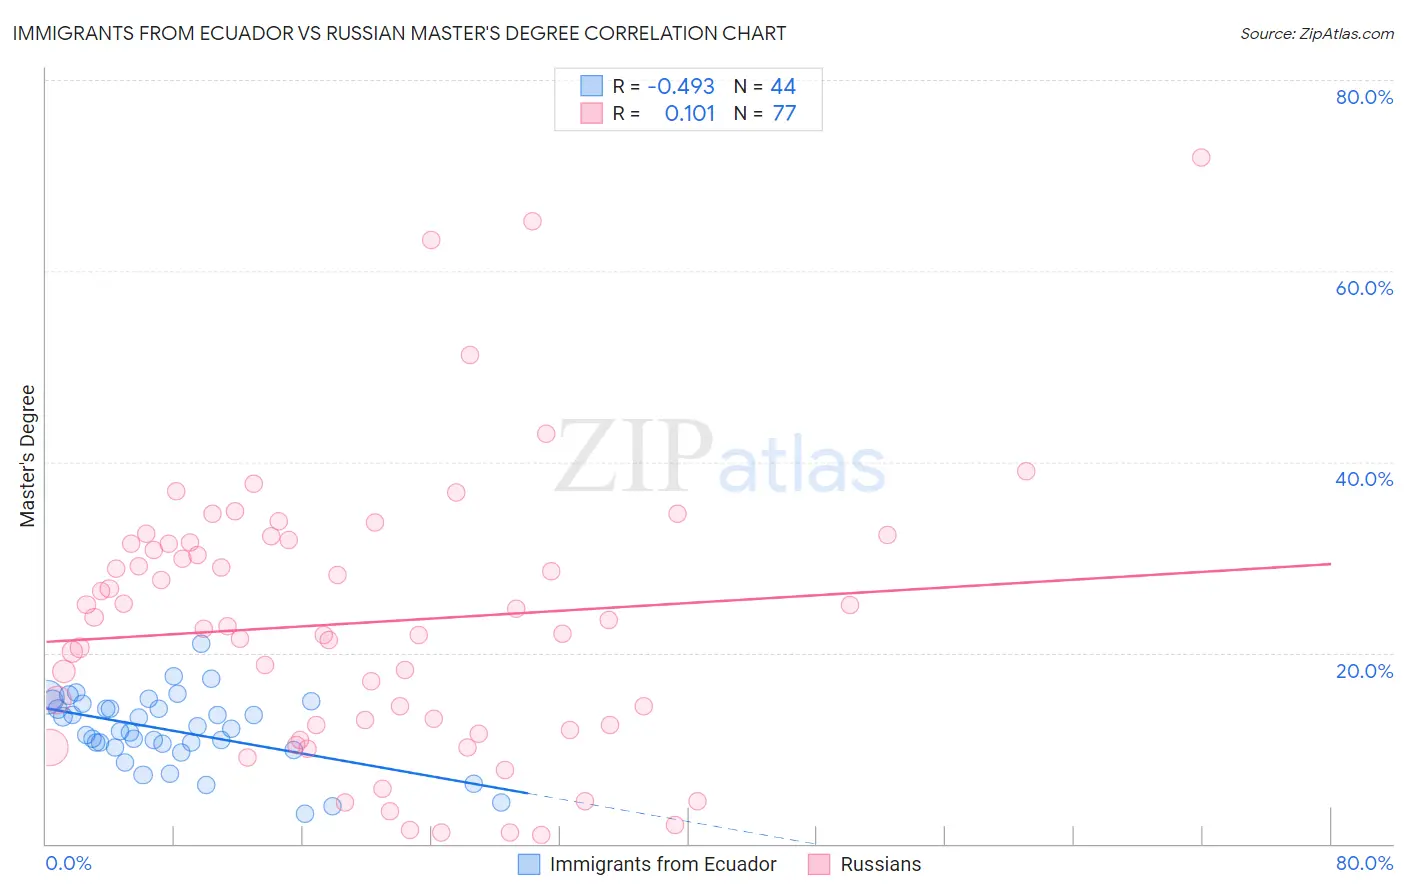
Immigrants from Ecuador vs Russian Master's Degree Correlation Chart
The statistical analysis conducted on geographies consisting of 270,930,295 people shows a moderate negative correlation between the proportion of Immigrants from Ecuador and percentage of population with at least master's degree education in the United States with a correlation coefficient (R) of -0.493 and weighted average of 13.6%. Similarly, the statistical analysis conducted on geographies consisting of 511,948,246 people shows a poor positive correlation between the proportion of Russians and percentage of population with at least master's degree education in the United States with a correlation coefficient (R) of 0.101 and weighted average of 19.5%, a difference of 43.9%.
Master's Degree Correlation Summary
| Measurement | Immigrants from Ecuador | Russian |
| Minimum | 3.1% | 0.93% |
| Maximum | 21.0% | 71.9% |
| Range | 17.9% | 70.9% |
| Mean | 11.9% | 23.2% |
| Median | 11.9% | 22.8% |
| Interquartile 25% (IQ1) | 10.2% | 12.2% |
| Interquartile 75% (IQ3) | 14.4% | 31.5% |
| Interquartile Range (IQR) | 4.2% | 19.3% |
| Standard Deviation (Sample) | 3.8% | 14.4% |
| Standard Deviation (Population) | 3.7% | 14.3% |
Similar Demographics by Master's Degree
Demographics Similar to Immigrants from Ecuador by Master's Degree
In terms of master's degree, the demographic groups most similar to Immigrants from Ecuador are Immigrants from Philippines (13.6%, a difference of 0.15%), Immigrants from Burma/Myanmar (13.5%, a difference of 0.50%), German Russian (13.5%, a difference of 0.91%), Immigrants from Guyana (13.4%, a difference of 1.0%), and Guyanese (13.7%, a difference of 1.0%).
| Demographics | Rating | Rank | Master's Degree |
| Immigrants | St. Vincent and the Grenadines | 11.0 /100 | #226 | Poor 13.9% |
| Immigrants | West Indies | 9.8 /100 | #227 | Tragic 13.9% |
| Whites/Caucasians | 9.1 /100 | #228 | Tragic 13.8% |
| British West Indians | 8.8 /100 | #229 | Tragic 13.8% |
| Dutch | 8.7 /100 | #230 | Tragic 13.8% |
| Guyanese | 7.6 /100 | #231 | Tragic 13.7% |
| Immigrants | Philippines | 6.0 /100 | #232 | Tragic 13.6% |
| Immigrants | Ecuador | 5.7 /100 | #233 | Tragic 13.6% |
| Immigrants | Burma/Myanmar | 5.0 /100 | #234 | Tragic 13.5% |
| German Russians | 4.5 /100 | #235 | Tragic 13.5% |
| Immigrants | Guyana | 4.4 /100 | #236 | Tragic 13.4% |
| Jamaicans | 4.1 /100 | #237 | Tragic 13.4% |
| Hmong | 4.0 /100 | #238 | Tragic 13.4% |
| Immigrants | Nonimmigrants | 3.4 /100 | #239 | Tragic 13.3% |
| Guamanians/Chamorros | 2.2 /100 | #240 | Tragic 13.1% |
Demographics Similar to Russians by Master's Degree
In terms of master's degree, the demographic groups most similar to Russians are Immigrants from Denmark (19.5%, a difference of 0.030%), Immigrants from Northern Europe (19.5%, a difference of 0.36%), Immigrants from Russia (19.4%, a difference of 0.73%), Mongolian (19.4%, a difference of 0.77%), and Burmese (19.7%, a difference of 0.79%).
| Demographics | Rating | Rank | Master's Degree |
| Cambodians | 100.0 /100 | #26 | Exceptional 20.0% |
| Immigrants | Sri Lanka | 100.0 /100 | #27 | Exceptional 19.9% |
| Turks | 100.0 /100 | #28 | Exceptional 19.9% |
| Latvians | 100.0 /100 | #29 | Exceptional 19.8% |
| Immigrants | Turkey | 100.0 /100 | #30 | Exceptional 19.7% |
| Immigrants | Korea | 100.0 /100 | #31 | Exceptional 19.7% |
| Burmese | 100.0 /100 | #32 | Exceptional 19.7% |
| Russians | 100.0 /100 | #33 | Exceptional 19.5% |
| Immigrants | Denmark | 100.0 /100 | #34 | Exceptional 19.5% |
| Immigrants | Northern Europe | 100.0 /100 | #35 | Exceptional 19.5% |
| Immigrants | Russia | 100.0 /100 | #36 | Exceptional 19.4% |
| Mongolians | 100.0 /100 | #37 | Exceptional 19.4% |
| Bolivians | 100.0 /100 | #38 | Exceptional 19.3% |
| Immigrants | Spain | 100.0 /100 | #39 | Exceptional 19.1% |
| Immigrants | Bolivia | 100.0 /100 | #40 | Exceptional 19.1% |