Immigrants from Ecuador vs Immigrants from Dominica Master's Degree
COMPARE
Immigrants from Ecuador
Immigrants from Dominica
Master's Degree
Master's Degree Comparison
Immigrants from Ecuador
Immigrants from Dominica
13.6%
MASTER'S DEGREE
5.7/ 100
METRIC RATING
233rd/ 347
METRIC RANK
12.6%
MASTER'S DEGREE
0.8/ 100
METRIC RATING
253rd/ 347
METRIC RANK
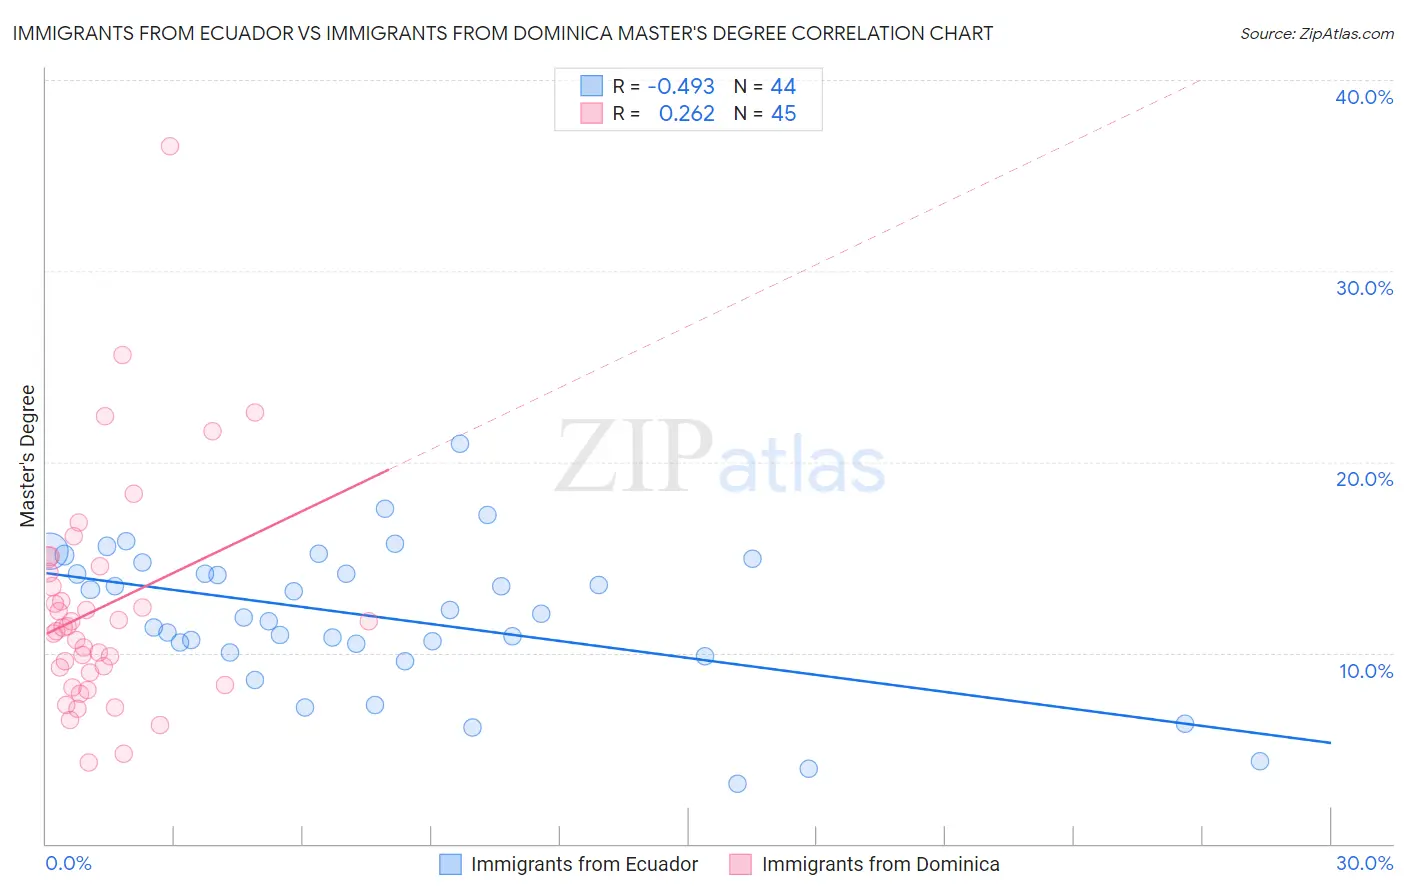
Immigrants from Ecuador vs Immigrants from Dominica Master's Degree Correlation Chart
The statistical analysis conducted on geographies consisting of 270,930,295 people shows a moderate negative correlation between the proportion of Immigrants from Ecuador and percentage of population with at least master's degree education in the United States with a correlation coefficient (R) of -0.493 and weighted average of 13.6%. Similarly, the statistical analysis conducted on geographies consisting of 83,792,666 people shows a weak positive correlation between the proportion of Immigrants from Dominica and percentage of population with at least master's degree education in the United States with a correlation coefficient (R) of 0.262 and weighted average of 12.6%, a difference of 7.4%.
Master's Degree Correlation Summary
| Measurement | Immigrants from Ecuador | Immigrants from Dominica |
| Minimum | 3.1% | 4.3% |
| Maximum | 21.0% | 36.5% |
| Range | 17.9% | 32.3% |
| Mean | 11.9% | 12.4% |
| Median | 11.9% | 11.3% |
| Interquartile 25% (IQ1) | 10.2% | 8.6% |
| Interquartile 75% (IQ3) | 14.4% | 14.4% |
| Interquartile Range (IQR) | 4.2% | 5.7% |
| Standard Deviation (Sample) | 3.8% | 6.0% |
| Standard Deviation (Population) | 3.7% | 5.9% |
Demographics Similar to Immigrants from Ecuador and Immigrants from Dominica by Master's Degree
In terms of master's degree, the demographic groups most similar to Immigrants from Ecuador are Immigrants from Burma/Myanmar (13.5%, a difference of 0.50%), German Russian (13.5%, a difference of 0.91%), Immigrants from Guyana (13.4%, a difference of 1.0%), Jamaican (13.4%, a difference of 1.3%), and Hmong (13.4%, a difference of 1.4%). Similarly, the demographic groups most similar to Immigrants from Dominica are French American Indian (12.7%, a difference of 0.54%), Tlingit-Haida (12.8%, a difference of 1.5%), Liberian (12.8%, a difference of 1.6%), Cree (12.8%, a difference of 1.6%), and African (12.9%, a difference of 1.9%).
| Demographics | Rating | Rank | Master's Degree |
| Immigrants | Ecuador | 5.7 /100 | #233 | Tragic 13.6% |
| Immigrants | Burma/Myanmar | 5.0 /100 | #234 | Tragic 13.5% |
| German Russians | 4.5 /100 | #235 | Tragic 13.5% |
| Immigrants | Guyana | 4.4 /100 | #236 | Tragic 13.4% |
| Jamaicans | 4.1 /100 | #237 | Tragic 13.4% |
| Hmong | 4.0 /100 | #238 | Tragic 13.4% |
| Immigrants | Nonimmigrants | 3.4 /100 | #239 | Tragic 13.3% |
| Guamanians/Chamorros | 2.2 /100 | #240 | Tragic 13.1% |
| U.S. Virgin Islanders | 2.1 /100 | #241 | Tragic 13.1% |
| Spanish Americans | 1.9 /100 | #242 | Tragic 13.0% |
| Immigrants | Jamaica | 1.9 /100 | #243 | Tragic 13.0% |
| Delaware | 1.7 /100 | #244 | Tragic 13.0% |
| Immigrants | Bahamas | 1.4 /100 | #245 | Tragic 12.9% |
| Immigrants | Cambodia | 1.4 /100 | #246 | Tragic 12.9% |
| Iroquois | 1.4 /100 | #247 | Tragic 12.9% |
| Africans | 1.4 /100 | #248 | Tragic 12.9% |
| Cree | 1.3 /100 | #249 | Tragic 12.8% |
| Liberians | 1.3 /100 | #250 | Tragic 12.8% |
| Tlingit-Haida | 1.3 /100 | #251 | Tragic 12.8% |
| French American Indians | 1.0 /100 | #252 | Tragic 12.7% |
| Immigrants | Dominica | 0.8 /100 | #253 | Tragic 12.6% |