Immigrants from Dominican Republic vs Czech Professional Degree
COMPARE
Immigrants from Dominican Republic
Czech
Professional Degree
Professional Degree Comparison
Immigrants from Dominican Republic
Czechs
3.4%
PROFESSIONAL DEGREE
0.2/ 100
METRIC RATING
301st/ 347
METRIC RANK
4.4%
PROFESSIONAL DEGREE
44.9/ 100
METRIC RATING
180th/ 347
METRIC RANK
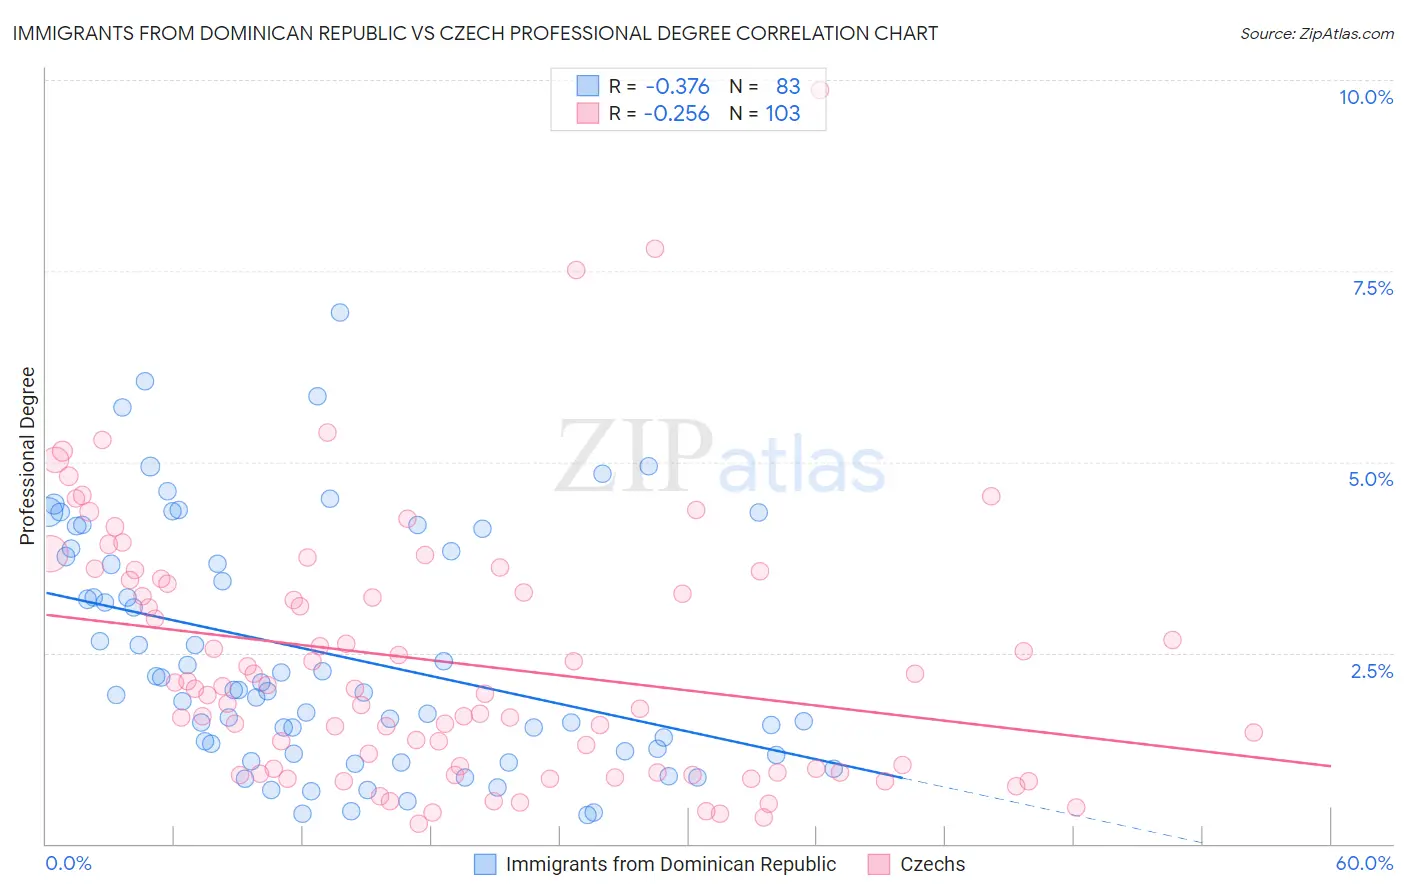
Immigrants from Dominican Republic vs Czech Professional Degree Correlation Chart
The statistical analysis conducted on geographies consisting of 274,641,839 people shows a mild negative correlation between the proportion of Immigrants from Dominican Republic and percentage of population with at least professional degree education in the United States with a correlation coefficient (R) of -0.376 and weighted average of 3.4%. Similarly, the statistical analysis conducted on geographies consisting of 481,986,557 people shows a weak negative correlation between the proportion of Czechs and percentage of population with at least professional degree education in the United States with a correlation coefficient (R) of -0.256 and weighted average of 4.4%, a difference of 28.7%.
Professional Degree Correlation Summary
| Measurement | Immigrants from Dominican Republic | Czech |
| Minimum | 0.38% | 0.26% |
| Maximum | 7.0% | 9.9% |
| Range | 6.6% | 9.6% |
| Mean | 2.5% | 2.4% |
| Median | 2.0% | 2.0% |
| Interquartile 25% (IQ1) | 1.2% | 0.93% |
| Interquartile 75% (IQ3) | 3.8% | 3.5% |
| Interquartile Range (IQR) | 2.6% | 2.5% |
| Standard Deviation (Sample) | 1.6% | 1.7% |
| Standard Deviation (Population) | 1.6% | 1.7% |
Similar Demographics by Professional Degree
Demographics Similar to Immigrants from Dominican Republic by Professional Degree
In terms of professional degree, the demographic groups most similar to Immigrants from Dominican Republic are Malaysian (3.4%, a difference of 0.11%), Black/African American (3.4%, a difference of 0.14%), Immigrants from Yemen (3.4%, a difference of 0.28%), Immigrants from Haiti (3.4%, a difference of 0.76%), and Cajun (3.4%, a difference of 0.77%).
| Demographics | Rating | Rank | Professional Degree |
| Paiute | 0.3 /100 | #294 | Tragic 3.4% |
| Immigrants | Guatemala | 0.2 /100 | #295 | Tragic 3.4% |
| Hawaiians | 0.2 /100 | #296 | Tragic 3.4% |
| Immigrants | Liberia | 0.2 /100 | #297 | Tragic 3.4% |
| Ottawa | 0.2 /100 | #298 | Tragic 3.4% |
| Immigrants | Yemen | 0.2 /100 | #299 | Tragic 3.4% |
| Blacks/African Americans | 0.2 /100 | #300 | Tragic 3.4% |
| Immigrants | Dominican Republic | 0.2 /100 | #301 | Tragic 3.4% |
| Malaysians | 0.2 /100 | #302 | Tragic 3.4% |
| Immigrants | Haiti | 0.2 /100 | #303 | Tragic 3.4% |
| Cajuns | 0.2 /100 | #304 | Tragic 3.4% |
| Chickasaw | 0.1 /100 | #305 | Tragic 3.4% |
| Cape Verdeans | 0.1 /100 | #306 | Tragic 3.4% |
| Samoans | 0.1 /100 | #307 | Tragic 3.3% |
| Shoshone | 0.1 /100 | #308 | Tragic 3.3% |
Demographics Similar to Czechs by Professional Degree
In terms of professional degree, the demographic groups most similar to Czechs are Immigrants from Kenya (4.4%, a difference of 0.15%), Danish (4.4%, a difference of 0.22%), Immigrants from Costa Rica (4.4%, a difference of 0.26%), Immigrants (4.4%, a difference of 0.26%), and Bermudan (4.4%, a difference of 0.28%).
| Demographics | Rating | Rank | Professional Degree |
| English | 50.1 /100 | #173 | Average 4.4% |
| Kenyans | 50.0 /100 | #174 | Average 4.4% |
| Irish | 50.0 /100 | #175 | Average 4.4% |
| Immigrants | Peru | 49.3 /100 | #176 | Average 4.4% |
| Celtics | 47.6 /100 | #177 | Average 4.4% |
| Immigrants | Costa Rica | 46.7 /100 | #178 | Average 4.4% |
| Immigrants | Kenya | 45.9 /100 | #179 | Average 4.4% |
| Czechs | 44.9 /100 | #180 | Average 4.4% |
| Danes | 43.5 /100 | #181 | Average 4.4% |
| Immigrants | Immigrants | 43.2 /100 | #182 | Average 4.4% |
| Bermudans | 43.1 /100 | #183 | Average 4.4% |
| Belgians | 36.2 /100 | #184 | Fair 4.3% |
| Welsh | 35.8 /100 | #185 | Fair 4.3% |
| Scotch-Irish | 34.2 /100 | #186 | Fair 4.3% |
| Immigrants | Cameroon | 33.3 /100 | #187 | Fair 4.3% |