Immigrants from Dominican Republic vs Immigrants from Cameroon College, 1 year or more
COMPARE
Immigrants from Dominican Republic
Immigrants from Cameroon
College, 1 year or more
College, 1 year or more Comparison
Immigrants from Dominican Republic
Immigrants from Cameroon
49.1%
COLLEGE, 1 YEAR OR MORE
0.0/ 100
METRIC RATING
333rd/ 347
METRIC RANK
58.8%
COLLEGE, 1 YEAR OR MORE
31.2/ 100
METRIC RATING
190th/ 347
METRIC RANK
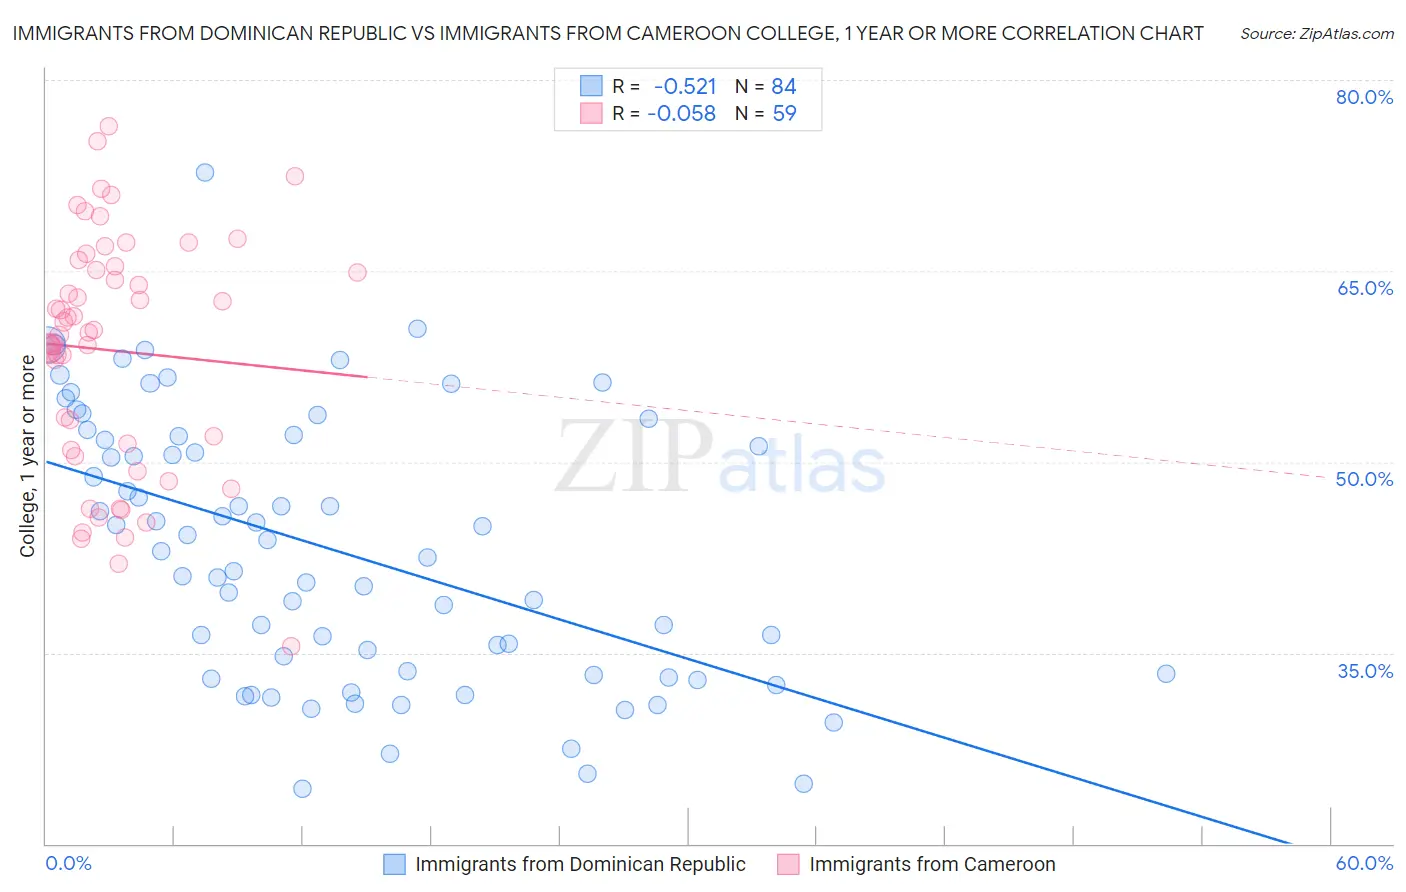
Immigrants from Dominican Republic vs Immigrants from Cameroon College, 1 year or more Correlation Chart
The statistical analysis conducted on geographies consisting of 275,143,955 people shows a substantial negative correlation between the proportion of Immigrants from Dominican Republic and percentage of population with at least college, 1 year or more education in the United States with a correlation coefficient (R) of -0.521 and weighted average of 49.1%. Similarly, the statistical analysis conducted on geographies consisting of 130,767,721 people shows a slight negative correlation between the proportion of Immigrants from Cameroon and percentage of population with at least college, 1 year or more education in the United States with a correlation coefficient (R) of -0.058 and weighted average of 58.8%, a difference of 19.6%.
College, 1 year or more Correlation Summary
| Measurement | Immigrants from Dominican Republic | Immigrants from Cameroon |
| Minimum | 24.3% | 35.5% |
| Maximum | 72.7% | 76.4% |
| Range | 48.4% | 40.9% |
| Mean | 43.0% | 58.7% |
| Median | 42.7% | 60.2% |
| Interquartile 25% (IQ1) | 33.3% | 50.9% |
| Interquartile 75% (IQ3) | 51.9% | 65.4% |
| Interquartile Range (IQR) | 18.6% | 14.5% |
| Standard Deviation (Sample) | 10.5% | 9.3% |
| Standard Deviation (Population) | 10.4% | 9.2% |
Similar Demographics by College, 1 year or more
Demographics Similar to Immigrants from Dominican Republic by College, 1 year or more
In terms of college, 1 year or more, the demographic groups most similar to Immigrants from Dominican Republic are Mexican (49.2%, a difference of 0.17%), Lumbee (48.9%, a difference of 0.58%), Yuman (48.7%, a difference of 0.86%), Spanish American Indian (48.5%, a difference of 1.3%), and Pennsylvania German (48.5%, a difference of 1.3%).
| Demographics | Rating | Rank | College, 1 year or more |
| Dominicans | 0.0 /100 | #326 | Tragic 50.6% |
| Menominee | 0.0 /100 | #327 | Tragic 50.6% |
| Dutch West Indians | 0.0 /100 | #328 | Tragic 50.5% |
| Cape Verdeans | 0.0 /100 | #329 | Tragic 50.3% |
| Natives/Alaskans | 0.0 /100 | #330 | Tragic 50.2% |
| Immigrants | Yemen | 0.0 /100 | #331 | Tragic 50.0% |
| Mexicans | 0.0 /100 | #332 | Tragic 49.2% |
| Immigrants | Dominican Republic | 0.0 /100 | #333 | Tragic 49.1% |
| Lumbee | 0.0 /100 | #334 | Tragic 48.9% |
| Yuman | 0.0 /100 | #335 | Tragic 48.7% |
| Spanish American Indians | 0.0 /100 | #336 | Tragic 48.5% |
| Pennsylvania Germans | 0.0 /100 | #337 | Tragic 48.5% |
| Immigrants | Central America | 0.0 /100 | #338 | Tragic 48.5% |
| Immigrants | Azores | 0.0 /100 | #339 | Tragic 48.4% |
| Immigrants | Cabo Verde | 0.0 /100 | #340 | Tragic 48.1% |
Demographics Similar to Immigrants from Cameroon by College, 1 year or more
In terms of college, 1 year or more, the demographic groups most similar to Immigrants from Cameroon are Uruguayan (58.8%, a difference of 0.040%), Immigrants from Philippines (58.7%, a difference of 0.13%), French (58.9%, a difference of 0.19%), Scotch-Irish (58.9%, a difference of 0.21%), and German (58.9%, a difference of 0.21%).
| Demographics | Rating | Rank | College, 1 year or more |
| German Russians | 39.3 /100 | #183 | Fair 59.1% |
| Spaniards | 38.3 /100 | #184 | Fair 59.0% |
| South Americans | 35.9 /100 | #185 | Fair 59.0% |
| Scotch-Irish | 34.7 /100 | #186 | Fair 58.9% |
| Germans | 34.7 /100 | #187 | Fair 58.9% |
| French | 34.4 /100 | #188 | Fair 58.9% |
| Uruguayans | 31.8 /100 | #189 | Fair 58.8% |
| Immigrants | Cameroon | 31.2 /100 | #190 | Fair 58.8% |
| Immigrants | Philippines | 29.2 /100 | #191 | Fair 58.7% |
| Colombians | 27.6 /100 | #192 | Fair 58.7% |
| Peruvians | 27.5 /100 | #193 | Fair 58.6% |
| Costa Ricans | 26.4 /100 | #194 | Fair 58.6% |
| Dutch | 26.2 /100 | #195 | Fair 58.6% |
| Guamanians/Chamorros | 26.2 /100 | #196 | Fair 58.6% |
| Immigrants | Thailand | 26.0 /100 | #197 | Fair 58.6% |