Immigrants from Cuba vs Pakistani Associate's Degree
COMPARE
Immigrants from Cuba
Pakistani
Associate's Degree
Associate's Degree Comparison
Immigrants from Cuba
Pakistanis
39.5%
ASSOCIATE'S DEGREE
0.0/ 100
METRIC RATING
288th/ 347
METRIC RANK
48.1%
ASSOCIATE'S DEGREE
88.0/ 100
METRIC RATING
136th/ 347
METRIC RANK
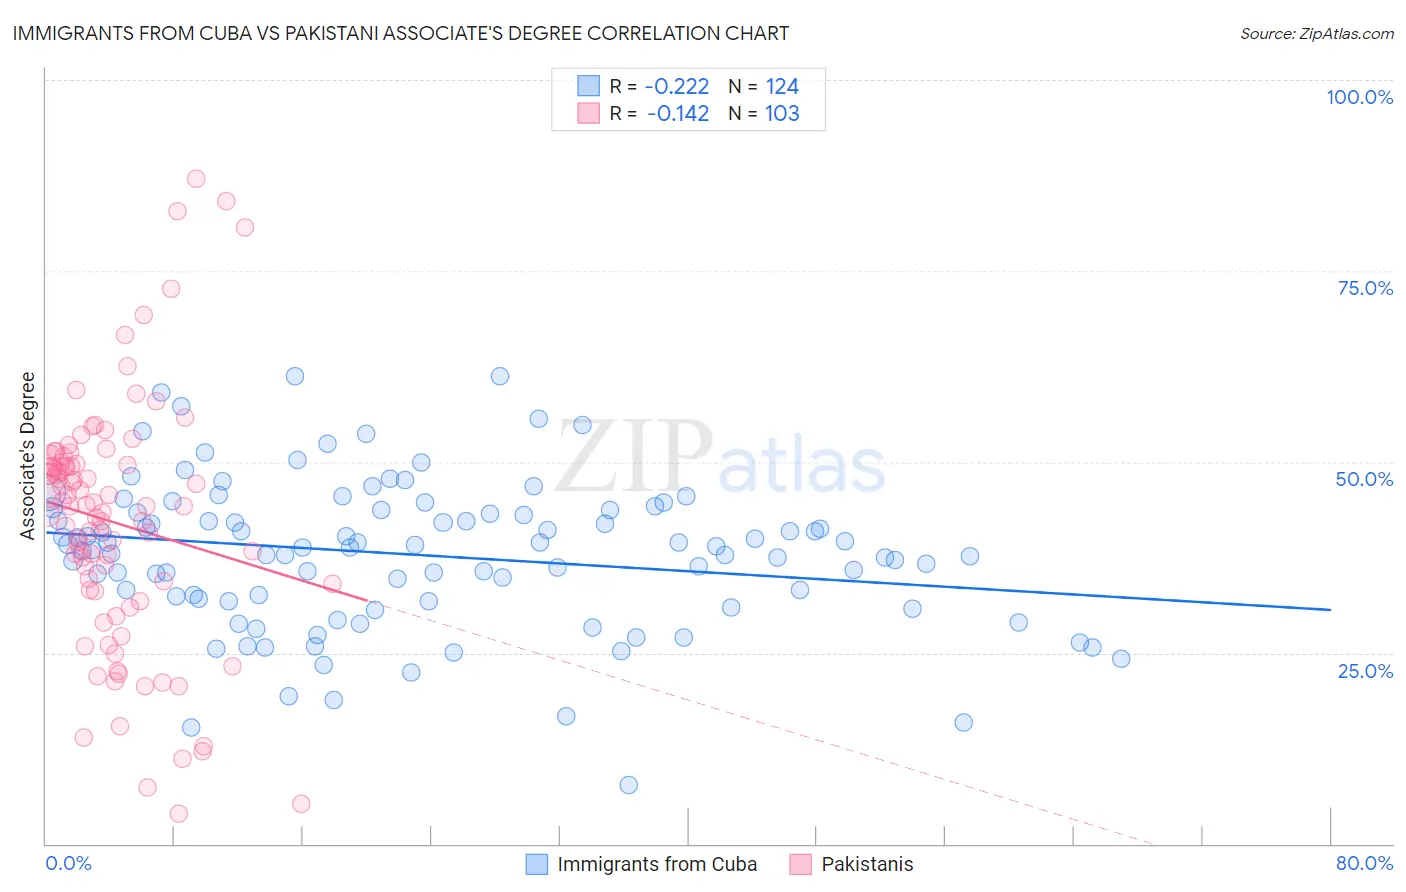
Immigrants from Cuba vs Pakistani Associate's Degree Correlation Chart
The statistical analysis conducted on geographies consisting of 325,963,552 people shows a weak negative correlation between the proportion of Immigrants from Cuba and percentage of population with at least associate's degree education in the United States with a correlation coefficient (R) of -0.222 and weighted average of 39.5%. Similarly, the statistical analysis conducted on geographies consisting of 335,329,831 people shows a poor negative correlation between the proportion of Pakistanis and percentage of population with at least associate's degree education in the United States with a correlation coefficient (R) of -0.142 and weighted average of 48.1%, a difference of 21.6%.
Associate's Degree Correlation Summary
| Measurement | Immigrants from Cuba | Pakistani |
| Minimum | 7.8% | 4.0% |
| Maximum | 61.3% | 87.1% |
| Range | 53.5% | 83.1% |
| Mean | 37.8% | 42.1% |
| Median | 38.8% | 44.2% |
| Interquartile 25% (IQ1) | 31.9% | 33.2% |
| Interquartile 75% (IQ3) | 43.6% | 49.8% |
| Interquartile Range (IQR) | 11.7% | 16.6% |
| Standard Deviation (Sample) | 9.7% | 16.2% |
| Standard Deviation (Population) | 9.6% | 16.1% |
Similar Demographics by Associate's Degree
Demographics Similar to Immigrants from Cuba by Associate's Degree
In terms of associate's degree, the demographic groups most similar to Immigrants from Cuba are Aleut (39.6%, a difference of 0.24%), Central American (39.4%, a difference of 0.26%), Immigrants from Caribbean (39.7%, a difference of 0.50%), Immigrants from Haiti (39.3%, a difference of 0.71%), and Dominican (39.3%, a difference of 0.72%).
| Demographics | Rating | Rank | Associate's Degree |
| Immigrants | Portugal | 0.1 /100 | #281 | Tragic 40.1% |
| Bangladeshis | 0.1 /100 | #282 | Tragic 40.0% |
| Haitians | 0.1 /100 | #283 | Tragic 40.0% |
| Comanche | 0.1 /100 | #284 | Tragic 39.9% |
| Immigrants | Belize | 0.1 /100 | #285 | Tragic 39.9% |
| Immigrants | Caribbean | 0.0 /100 | #286 | Tragic 39.7% |
| Aleuts | 0.0 /100 | #287 | Tragic 39.6% |
| Immigrants | Cuba | 0.0 /100 | #288 | Tragic 39.5% |
| Central Americans | 0.0 /100 | #289 | Tragic 39.4% |
| Immigrants | Haiti | 0.0 /100 | #290 | Tragic 39.3% |
| Dominicans | 0.0 /100 | #291 | Tragic 39.3% |
| Blacks/African Americans | 0.0 /100 | #292 | Tragic 39.1% |
| Nepalese | 0.0 /100 | #293 | Tragic 39.0% |
| Salvadorans | 0.0 /100 | #294 | Tragic 39.0% |
| Hondurans | 0.0 /100 | #295 | Tragic 38.9% |
Demographics Similar to Pakistanis by Associate's Degree
In terms of associate's degree, the demographic groups most similar to Pakistanis are Immigrants from Eritrea (48.1%, a difference of 0.040%), Polish (48.0%, a difference of 0.11%), European (48.2%, a difference of 0.18%), Moroccan (48.2%, a difference of 0.24%), and Assyrian/Chaldean/Syriac (48.2%, a difference of 0.26%).
| Demographics | Rating | Rank | Associate's Degree |
| Swedes | 91.5 /100 | #129 | Exceptional 48.4% |
| Immigrants | Jordan | 91.2 /100 | #130 | Exceptional 48.4% |
| Icelanders | 90.8 /100 | #131 | Exceptional 48.3% |
| Immigrants | Albania | 89.9 /100 | #132 | Excellent 48.2% |
| Assyrians/Chaldeans/Syriacs | 89.4 /100 | #133 | Excellent 48.2% |
| Moroccans | 89.3 /100 | #134 | Excellent 48.2% |
| Europeans | 89.0 /100 | #135 | Excellent 48.2% |
| Pakistanis | 88.0 /100 | #136 | Excellent 48.1% |
| Immigrants | Eritrea | 87.8 /100 | #137 | Excellent 48.1% |
| Poles | 87.3 /100 | #138 | Excellent 48.0% |
| Slovenes | 85.1 /100 | #139 | Excellent 47.9% |
| Immigrants | Southern Europe | 84.4 /100 | #140 | Excellent 47.8% |
| Taiwanese | 83.3 /100 | #141 | Excellent 47.7% |
| Sierra Leoneans | 82.9 /100 | #142 | Excellent 47.7% |
| Norwegians | 81.0 /100 | #143 | Excellent 47.6% |