Immigrants from Croatia vs Immigrants from Laos College, 1 year or more
COMPARE
Immigrants from Croatia
Immigrants from Laos
College, 1 year or more
College, 1 year or more Comparison
Immigrants from Croatia
Immigrants from Laos
62.3%
COLLEGE, 1 YEAR OR MORE
97.6/ 100
METRIC RATING
94th/ 347
METRIC RANK
54.7%
COLLEGE, 1 YEAR OR MORE
0.2/ 100
METRIC RATING
265th/ 347
METRIC RANK
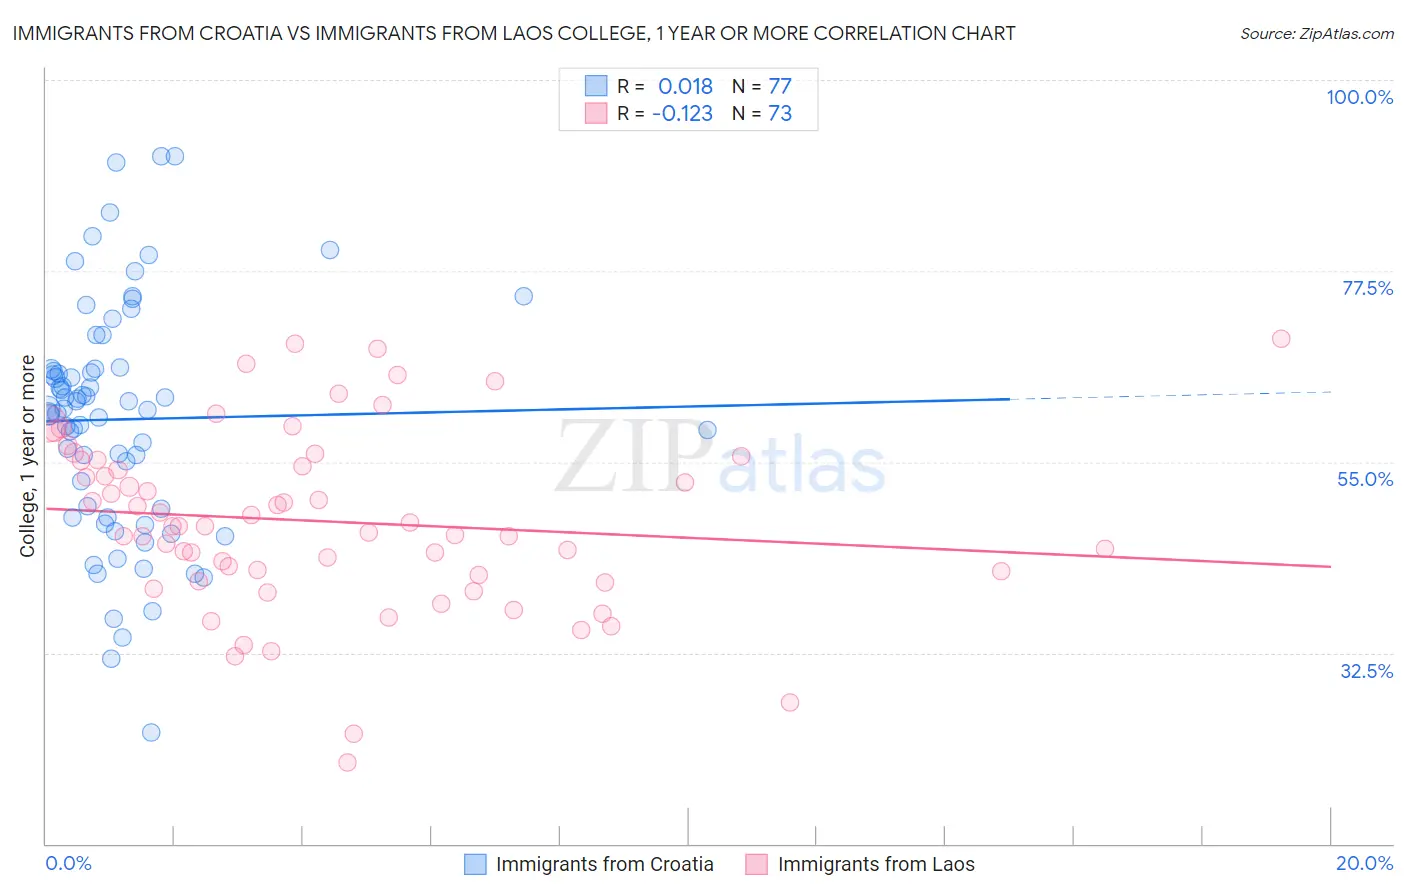
Immigrants from Croatia vs Immigrants from Laos College, 1 year or more Correlation Chart
The statistical analysis conducted on geographies consisting of 132,577,989 people shows no correlation between the proportion of Immigrants from Croatia and percentage of population with at least college, 1 year or more education in the United States with a correlation coefficient (R) of 0.018 and weighted average of 62.3%. Similarly, the statistical analysis conducted on geographies consisting of 201,475,535 people shows a poor negative correlation between the proportion of Immigrants from Laos and percentage of population with at least college, 1 year or more education in the United States with a correlation coefficient (R) of -0.123 and weighted average of 54.7%, a difference of 14.0%.
College, 1 year or more Correlation Summary
| Measurement | Immigrants from Croatia | Immigrants from Laos |
| Minimum | 23.1% | 19.6% |
| Maximum | 91.1% | 69.6% |
| Range | 68.0% | 49.9% |
| Mean | 60.0% | 48.0% |
| Median | 61.2% | 47.5% |
| Interquartile 25% (IQ1) | 49.0% | 41.3% |
| Interquartile 75% (IQ3) | 66.0% | 55.2% |
| Interquartile Range (IQR) | 17.0% | 13.9% |
| Standard Deviation (Sample) | 13.8% | 10.5% |
| Standard Deviation (Population) | 13.7% | 10.4% |
Similar Demographics by College, 1 year or more
Demographics Similar to Immigrants from Croatia by College, 1 year or more
In terms of college, 1 year or more, the demographic groups most similar to Immigrants from Croatia are Romanian (62.4%, a difference of 0.060%), Immigrants from Eastern Europe (62.4%, a difference of 0.090%), Immigrants from Egypt (62.4%, a difference of 0.090%), British (62.3%, a difference of 0.10%), and Immigrants from Western Asia (62.5%, a difference of 0.20%).
| Demographics | Rating | Rank | College, 1 year or more |
| Immigrants | Hungary | 98.6 /100 | #87 | Exceptional 62.7% |
| Greeks | 98.3 /100 | #88 | Exceptional 62.6% |
| Immigrants | Ethiopia | 98.2 /100 | #89 | Exceptional 62.6% |
| Immigrants | Western Asia | 97.9 /100 | #90 | Exceptional 62.5% |
| Immigrants | Eastern Europe | 97.8 /100 | #91 | Exceptional 62.4% |
| Immigrants | Egypt | 97.8 /100 | #92 | Exceptional 62.4% |
| Romanians | 97.7 /100 | #93 | Exceptional 62.4% |
| Immigrants | Croatia | 97.6 /100 | #94 | Exceptional 62.3% |
| British | 97.4 /100 | #95 | Exceptional 62.3% |
| Chinese | 97.2 /100 | #96 | Exceptional 62.2% |
| Jordanians | 97.2 /100 | #97 | Exceptional 62.2% |
| Carpatho Rusyns | 97.2 /100 | #98 | Exceptional 62.2% |
| Croatians | 97.1 /100 | #99 | Exceptional 62.2% |
| Icelanders | 96.8 /100 | #100 | Exceptional 62.1% |
| Swedes | 96.8 /100 | #101 | Exceptional 62.1% |
Demographics Similar to Immigrants from Laos by College, 1 year or more
In terms of college, 1 year or more, the demographic groups most similar to Immigrants from Laos are Potawatomi (54.6%, a difference of 0.050%), Blackfeet (54.6%, a difference of 0.12%), Immigrants from Micronesia (54.8%, a difference of 0.19%), U.S. Virgin Islander (54.8%, a difference of 0.22%), and Immigrants from St. Vincent and the Grenadines (54.8%, a difference of 0.24%).
| Demographics | Rating | Rank | College, 1 year or more |
| Africans | 0.4 /100 | #258 | Tragic 55.0% |
| Nepalese | 0.3 /100 | #259 | Tragic 54.9% |
| Jamaicans | 0.3 /100 | #260 | Tragic 54.9% |
| Ottawa | 0.3 /100 | #261 | Tragic 54.9% |
| Immigrants | St. Vincent and the Grenadines | 0.3 /100 | #262 | Tragic 54.8% |
| U.S. Virgin Islanders | 0.3 /100 | #263 | Tragic 54.8% |
| Immigrants | Micronesia | 0.3 /100 | #264 | Tragic 54.8% |
| Immigrants | Laos | 0.2 /100 | #265 | Tragic 54.7% |
| Potawatomi | 0.2 /100 | #266 | Tragic 54.6% |
| Blackfeet | 0.2 /100 | #267 | Tragic 54.6% |
| British West Indians | 0.2 /100 | #268 | Tragic 54.5% |
| Bangladeshis | 0.2 /100 | #269 | Tragic 54.5% |
| Crow | 0.2 /100 | #270 | Tragic 54.5% |
| Bahamians | 0.2 /100 | #271 | Tragic 54.5% |
| Comanche | 0.2 /100 | #272 | Tragic 54.4% |