Immigrants from Croatia vs Delaware College, 1 year or more
COMPARE
Immigrants from Croatia
Delaware
College, 1 year or more
College, 1 year or more Comparison
Immigrants from Croatia
Delaware
62.3%
COLLEGE, 1 YEAR OR MORE
97.6/ 100
METRIC RATING
94th/ 347
METRIC RANK
55.5%
COLLEGE, 1 YEAR OR MORE
0.7/ 100
METRIC RATING
250th/ 347
METRIC RANK
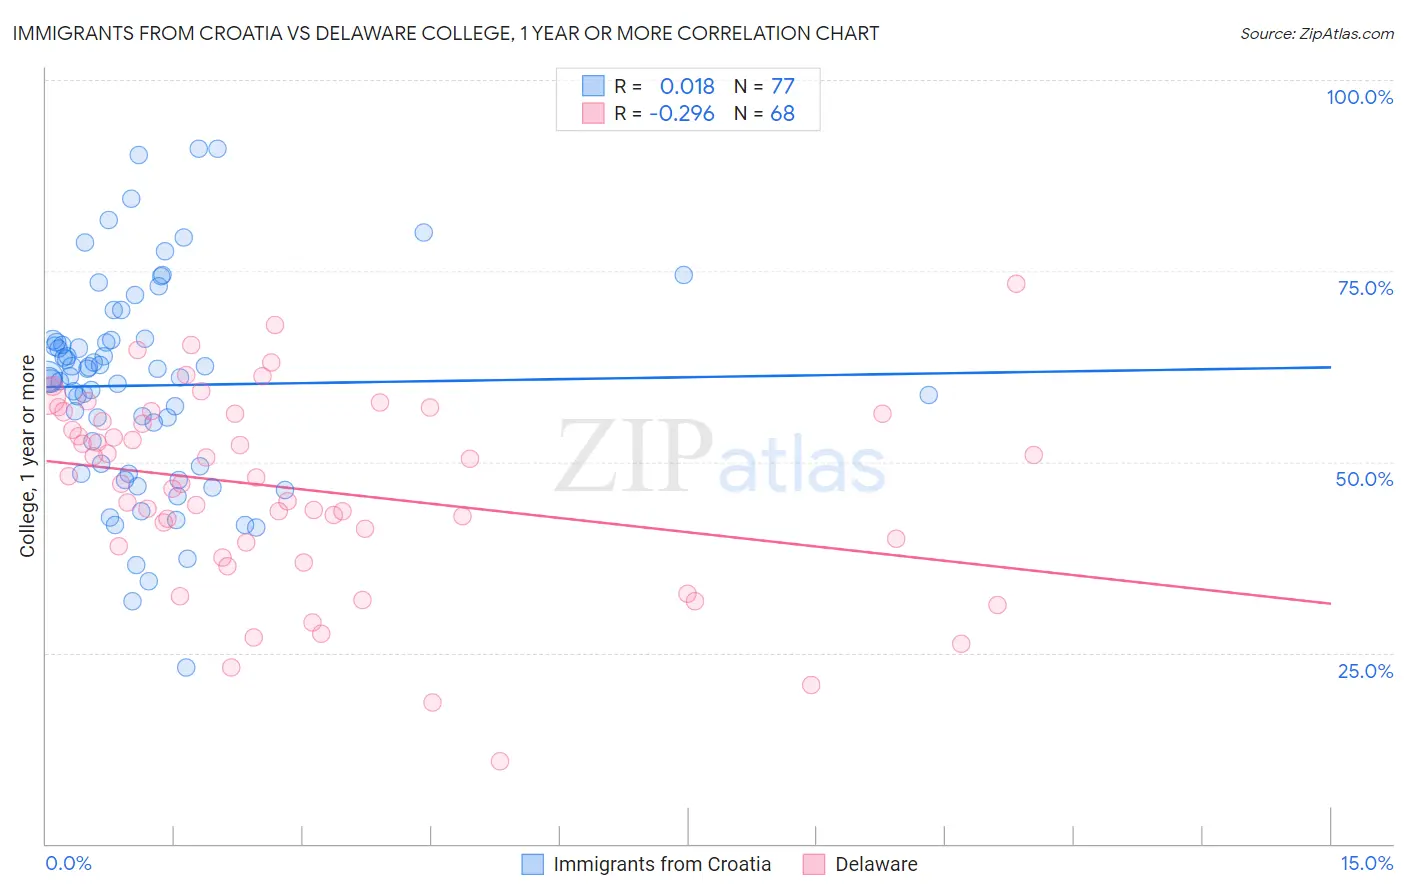
Immigrants from Croatia vs Delaware College, 1 year or more Correlation Chart
The statistical analysis conducted on geographies consisting of 132,577,989 people shows no correlation between the proportion of Immigrants from Croatia and percentage of population with at least college, 1 year or more education in the United States with a correlation coefficient (R) of 0.018 and weighted average of 62.3%. Similarly, the statistical analysis conducted on geographies consisting of 96,235,398 people shows a weak negative correlation between the proportion of Delaware and percentage of population with at least college, 1 year or more education in the United States with a correlation coefficient (R) of -0.296 and weighted average of 55.5%, a difference of 12.3%.
College, 1 year or more Correlation Summary
| Measurement | Immigrants from Croatia | Delaware |
| Minimum | 23.1% | 10.9% |
| Maximum | 91.1% | 73.3% |
| Range | 68.0% | 62.5% |
| Mean | 60.0% | 46.4% |
| Median | 61.2% | 47.6% |
| Interquartile 25% (IQ1) | 49.0% | 39.2% |
| Interquartile 75% (IQ3) | 66.0% | 56.3% |
| Interquartile Range (IQR) | 17.0% | 17.1% |
| Standard Deviation (Sample) | 13.8% | 12.7% |
| Standard Deviation (Population) | 13.7% | 12.6% |
Similar Demographics by College, 1 year or more
Demographics Similar to Immigrants from Croatia by College, 1 year or more
In terms of college, 1 year or more, the demographic groups most similar to Immigrants from Croatia are Romanian (62.4%, a difference of 0.060%), Immigrants from Eastern Europe (62.4%, a difference of 0.090%), Immigrants from Egypt (62.4%, a difference of 0.090%), British (62.3%, a difference of 0.10%), and Immigrants from Western Asia (62.5%, a difference of 0.20%).
| Demographics | Rating | Rank | College, 1 year or more |
| Immigrants | Hungary | 98.6 /100 | #87 | Exceptional 62.7% |
| Greeks | 98.3 /100 | #88 | Exceptional 62.6% |
| Immigrants | Ethiopia | 98.2 /100 | #89 | Exceptional 62.6% |
| Immigrants | Western Asia | 97.9 /100 | #90 | Exceptional 62.5% |
| Immigrants | Eastern Europe | 97.8 /100 | #91 | Exceptional 62.4% |
| Immigrants | Egypt | 97.8 /100 | #92 | Exceptional 62.4% |
| Romanians | 97.7 /100 | #93 | Exceptional 62.4% |
| Immigrants | Croatia | 97.6 /100 | #94 | Exceptional 62.3% |
| British | 97.4 /100 | #95 | Exceptional 62.3% |
| Chinese | 97.2 /100 | #96 | Exceptional 62.2% |
| Jordanians | 97.2 /100 | #97 | Exceptional 62.2% |
| Carpatho Rusyns | 97.2 /100 | #98 | Exceptional 62.2% |
| Croatians | 97.1 /100 | #99 | Exceptional 62.2% |
| Icelanders | 96.8 /100 | #100 | Exceptional 62.1% |
| Swedes | 96.8 /100 | #101 | Exceptional 62.1% |
Demographics Similar to Delaware by College, 1 year or more
In terms of college, 1 year or more, the demographic groups most similar to Delaware are Immigrants from Trinidad and Tobago (55.5%, a difference of 0.020%), Immigrants from Cambodia (55.4%, a difference of 0.090%), Immigrants from Congo (55.6%, a difference of 0.12%), Aleut (55.4%, a difference of 0.12%), and Hawaiian (55.6%, a difference of 0.16%).
| Demographics | Rating | Rank | College, 1 year or more |
| Osage | 1.0 /100 | #243 | Tragic 55.8% |
| Chippewa | 0.9 /100 | #244 | Tragic 55.7% |
| Immigrants | Liberia | 0.8 /100 | #245 | Tragic 55.7% |
| Malaysians | 0.8 /100 | #246 | Tragic 55.6% |
| Hawaiians | 0.8 /100 | #247 | Tragic 55.6% |
| Immigrants | Congo | 0.8 /100 | #248 | Tragic 55.6% |
| Immigrants | Trinidad and Tobago | 0.7 /100 | #249 | Tragic 55.5% |
| Delaware | 0.7 /100 | #250 | Tragic 55.5% |
| Immigrants | Cambodia | 0.6 /100 | #251 | Tragic 55.4% |
| Aleuts | 0.6 /100 | #252 | Tragic 55.4% |
| Immigrants | Barbados | 0.6 /100 | #253 | Tragic 55.4% |
| Japanese | 0.5 /100 | #254 | Tragic 55.2% |
| Immigrants | Bahamas | 0.5 /100 | #255 | Tragic 55.2% |
| Immigrants | West Indies | 0.5 /100 | #256 | Tragic 55.2% |
| Indonesians | 0.4 /100 | #257 | Tragic 55.1% |