Immigrants from Iraq vs Immigrants from Laos College, 1 year or more
COMPARE
Immigrants from Iraq
Immigrants from Laos
College, 1 year or more
College, 1 year or more Comparison
Immigrants from Iraq
Immigrants from Laos
60.0%
COLLEGE, 1 YEAR OR MORE
67.0/ 100
METRIC RATING
159th/ 347
METRIC RANK
54.7%
COLLEGE, 1 YEAR OR MORE
0.2/ 100
METRIC RATING
265th/ 347
METRIC RANK
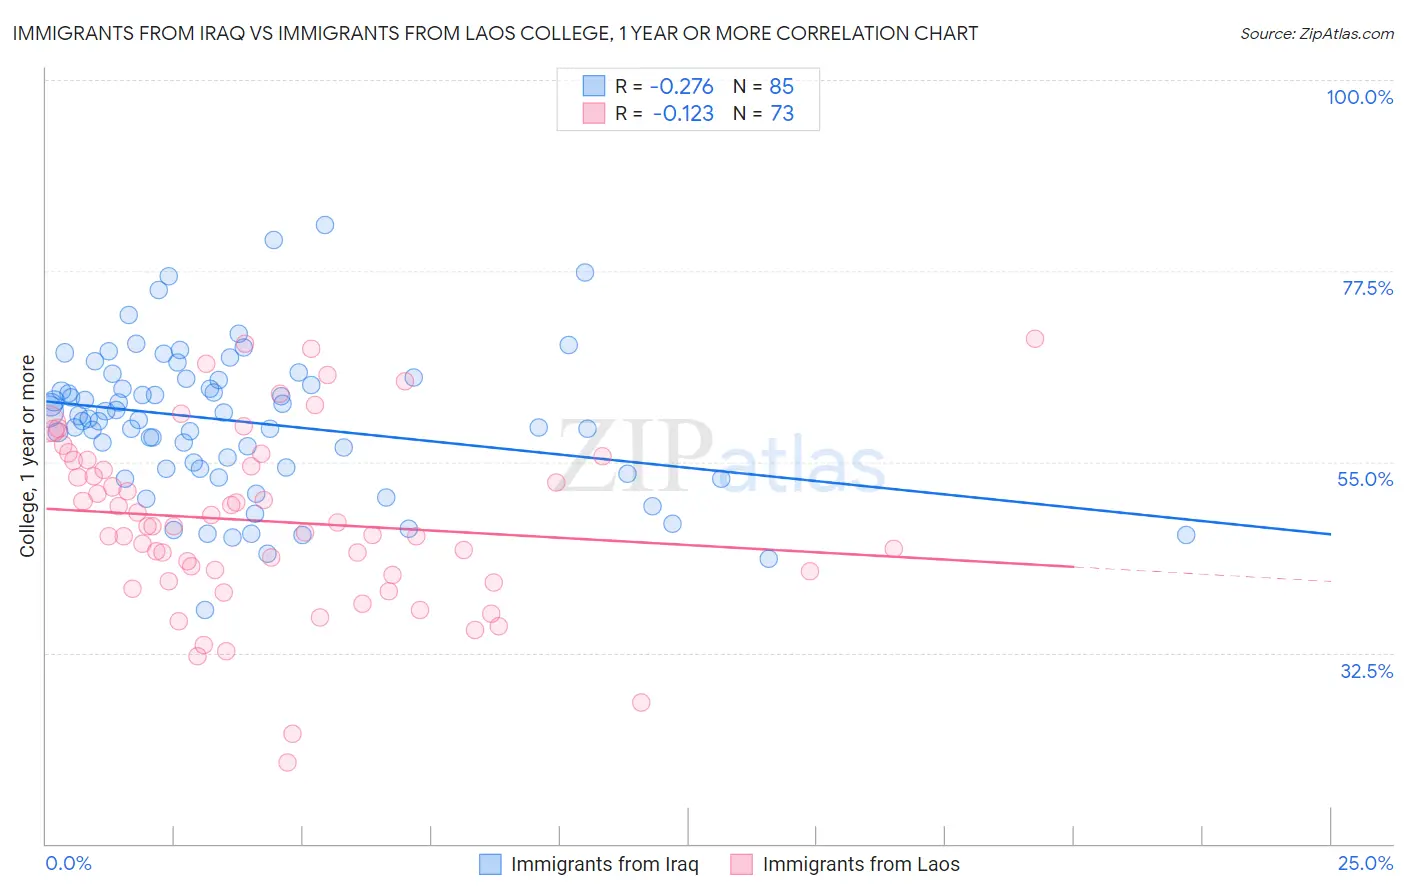
Immigrants from Iraq vs Immigrants from Laos College, 1 year or more Correlation Chart
The statistical analysis conducted on geographies consisting of 194,780,026 people shows a weak negative correlation between the proportion of Immigrants from Iraq and percentage of population with at least college, 1 year or more education in the United States with a correlation coefficient (R) of -0.276 and weighted average of 60.0%. Similarly, the statistical analysis conducted on geographies consisting of 201,475,535 people shows a poor negative correlation between the proportion of Immigrants from Laos and percentage of population with at least college, 1 year or more education in the United States with a correlation coefficient (R) of -0.123 and weighted average of 54.7%, a difference of 9.7%.
College, 1 year or more Correlation Summary
| Measurement | Immigrants from Iraq | Immigrants from Laos |
| Minimum | 37.6% | 19.6% |
| Maximum | 82.9% | 69.6% |
| Range | 45.3% | 49.9% |
| Mean | 59.7% | 48.0% |
| Median | 60.2% | 47.5% |
| Interquartile 25% (IQ1) | 54.1% | 41.3% |
| Interquartile 75% (IQ3) | 64.8% | 55.2% |
| Interquartile Range (IQR) | 10.6% | 13.9% |
| Standard Deviation (Sample) | 8.6% | 10.5% |
| Standard Deviation (Population) | 8.6% | 10.4% |
Similar Demographics by College, 1 year or more
Demographics Similar to Immigrants from Iraq by College, 1 year or more
In terms of college, 1 year or more, the demographic groups most similar to Immigrants from Iraq are English (60.0%, a difference of 0.010%), South American Indian (60.0%, a difference of 0.010%), Immigrants from Armenia (60.0%, a difference of 0.11%), Somali (59.9%, a difference of 0.15%), and Sudanese (60.2%, a difference of 0.37%).
| Demographics | Rating | Rank | College, 1 year or more |
| Immigrants | Germany | 76.1 /100 | #152 | Good 60.3% |
| Sierra Leoneans | 74.1 /100 | #153 | Good 60.2% |
| Sudanese | 73.0 /100 | #154 | Good 60.2% |
| Moroccans | 72.9 /100 | #155 | Good 60.2% |
| Finns | 72.9 /100 | #156 | Good 60.2% |
| Immigrants | Armenia | 68.8 /100 | #157 | Good 60.0% |
| English | 67.2 /100 | #158 | Good 60.0% |
| Immigrants | Iraq | 67.0 /100 | #159 | Good 60.0% |
| South American Indians | 66.9 /100 | #160 | Good 60.0% |
| Somalis | 64.5 /100 | #161 | Good 59.9% |
| Koreans | 58.5 /100 | #162 | Average 59.7% |
| Immigrants | Somalia | 58.3 /100 | #163 | Average 59.7% |
| Belgians | 58.1 /100 | #164 | Average 59.7% |
| Irish | 56.1 /100 | #165 | Average 59.6% |
| Immigrants | Africa | 56.1 /100 | #166 | Average 59.6% |
Demographics Similar to Immigrants from Laos by College, 1 year or more
In terms of college, 1 year or more, the demographic groups most similar to Immigrants from Laos are Potawatomi (54.6%, a difference of 0.050%), Blackfeet (54.6%, a difference of 0.12%), Immigrants from Micronesia (54.8%, a difference of 0.19%), U.S. Virgin Islander (54.8%, a difference of 0.22%), and Immigrants from St. Vincent and the Grenadines (54.8%, a difference of 0.24%).
| Demographics | Rating | Rank | College, 1 year or more |
| Africans | 0.4 /100 | #258 | Tragic 55.0% |
| Nepalese | 0.3 /100 | #259 | Tragic 54.9% |
| Jamaicans | 0.3 /100 | #260 | Tragic 54.9% |
| Ottawa | 0.3 /100 | #261 | Tragic 54.9% |
| Immigrants | St. Vincent and the Grenadines | 0.3 /100 | #262 | Tragic 54.8% |
| U.S. Virgin Islanders | 0.3 /100 | #263 | Tragic 54.8% |
| Immigrants | Micronesia | 0.3 /100 | #264 | Tragic 54.8% |
| Immigrants | Laos | 0.2 /100 | #265 | Tragic 54.7% |
| Potawatomi | 0.2 /100 | #266 | Tragic 54.6% |
| Blackfeet | 0.2 /100 | #267 | Tragic 54.6% |
| British West Indians | 0.2 /100 | #268 | Tragic 54.5% |
| Bangladeshis | 0.2 /100 | #269 | Tragic 54.5% |
| Crow | 0.2 /100 | #270 | Tragic 54.5% |
| Bahamians | 0.2 /100 | #271 | Tragic 54.5% |
| Comanche | 0.2 /100 | #272 | Tragic 54.4% |