Immigrants from Congo vs Honduran Bachelor's Degree
COMPARE
Immigrants from Congo
Honduran
Bachelor's Degree
Bachelor's Degree Comparison
Immigrants from Congo
Hondurans
33.6%
BACHELOR'S DEGREE
1.0/ 100
METRIC RATING
247th/ 347
METRIC RANK
31.3%
BACHELOR'S DEGREE
0.1/ 100
METRIC RATING
283rd/ 347
METRIC RANK
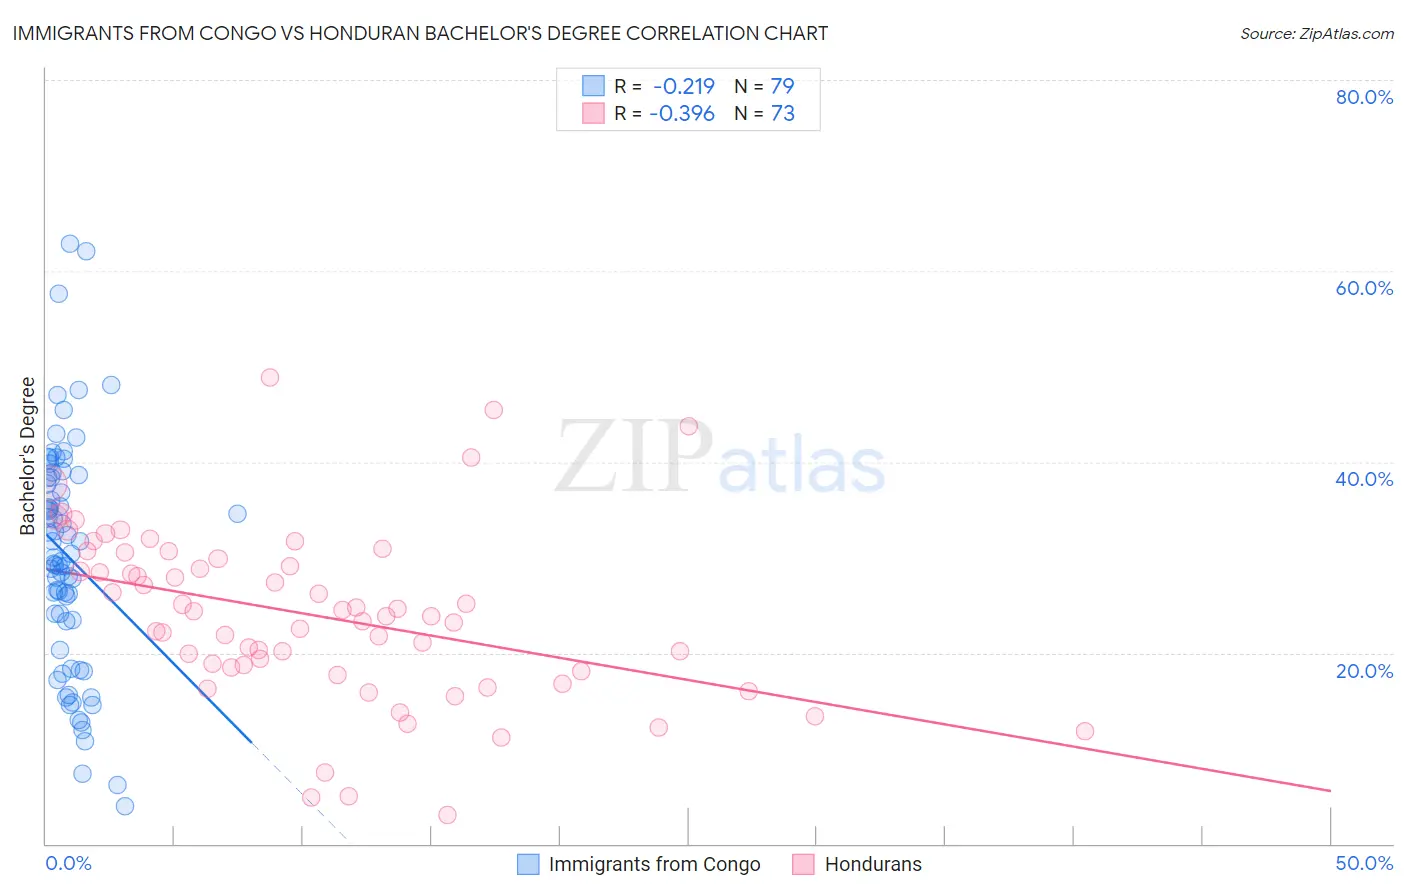
Immigrants from Congo vs Honduran Bachelor's Degree Correlation Chart
The statistical analysis conducted on geographies consisting of 92,128,050 people shows a weak negative correlation between the proportion of Immigrants from Congo and percentage of population with at least bachelor's degree education in the United States with a correlation coefficient (R) of -0.219 and weighted average of 33.6%. Similarly, the statistical analysis conducted on geographies consisting of 357,779,411 people shows a mild negative correlation between the proportion of Hondurans and percentage of population with at least bachelor's degree education in the United States with a correlation coefficient (R) of -0.396 and weighted average of 31.3%, a difference of 7.2%.
Bachelor's Degree Correlation Summary
| Measurement | Immigrants from Congo | Honduran |
| Minimum | 3.9% | 3.0% |
| Maximum | 62.9% | 48.9% |
| Range | 59.0% | 45.9% |
| Mean | 30.2% | 24.0% |
| Median | 30.0% | 23.9% |
| Interquartile 25% (IQ1) | 23.3% | 18.3% |
| Interquartile 75% (IQ3) | 38.4% | 30.2% |
| Interquartile Range (IQR) | 15.1% | 11.9% |
| Standard Deviation (Sample) | 12.1% | 9.1% |
| Standard Deviation (Population) | 12.0% | 9.0% |
Similar Demographics by Bachelor's Degree
Demographics Similar to Immigrants from Congo by Bachelor's Degree
In terms of bachelor's degree, the demographic groups most similar to Immigrants from Congo are Cree (33.6%, a difference of 0.010%), Jamaican (33.6%, a difference of 0.090%), Immigrants from Liberia (33.5%, a difference of 0.14%), Indonesian (33.5%, a difference of 0.15%), and Immigrants from Fiji (33.7%, a difference of 0.45%).
| Demographics | Rating | Rank | Bachelor's Degree |
| Tongans | 2.0 /100 | #240 | Tragic 34.3% |
| Immigrants | Cambodia | 1.9 /100 | #241 | Tragic 34.2% |
| Immigrants | Nonimmigrants | 1.8 /100 | #242 | Tragic 34.2% |
| Immigrants | Guyana | 1.4 /100 | #243 | Tragic 33.9% |
| Delaware | 1.2 /100 | #244 | Tragic 33.8% |
| Immigrants | Fiji | 1.2 /100 | #245 | Tragic 33.7% |
| Jamaicans | 1.0 /100 | #246 | Tragic 33.6% |
| Immigrants | Congo | 1.0 /100 | #247 | Tragic 33.6% |
| Cree | 1.0 /100 | #248 | Tragic 33.6% |
| Immigrants | Liberia | 0.9 /100 | #249 | Tragic 33.5% |
| Indonesians | 0.9 /100 | #250 | Tragic 33.5% |
| Japanese | 0.7 /100 | #251 | Tragic 33.3% |
| Immigrants | Bahamas | 0.7 /100 | #252 | Tragic 33.3% |
| U.S. Virgin Islanders | 0.7 /100 | #253 | Tragic 33.2% |
| Native Hawaiians | 0.7 /100 | #254 | Tragic 33.2% |
Demographics Similar to Hondurans by Bachelor's Degree
In terms of bachelor's degree, the demographic groups most similar to Hondurans are Haitian (31.3%, a difference of 0.030%), Aleut (31.3%, a difference of 0.040%), Immigrants from El Salvador (31.3%, a difference of 0.10%), Immigrants from Caribbean (31.4%, a difference of 0.28%), and Blackfeet (31.5%, a difference of 0.42%).
| Demographics | Rating | Rank | Bachelor's Degree |
| Salvadorans | 0.1 /100 | #276 | Tragic 31.8% |
| Dominicans | 0.1 /100 | #277 | Tragic 31.8% |
| Marshallese | 0.1 /100 | #278 | Tragic 31.7% |
| Hawaiians | 0.1 /100 | #279 | Tragic 31.6% |
| Immigrants | Laos | 0.1 /100 | #280 | Tragic 31.6% |
| Blackfeet | 0.1 /100 | #281 | Tragic 31.5% |
| Immigrants | Caribbean | 0.1 /100 | #282 | Tragic 31.4% |
| Hondurans | 0.1 /100 | #283 | Tragic 31.3% |
| Haitians | 0.1 /100 | #284 | Tragic 31.3% |
| Aleuts | 0.1 /100 | #285 | Tragic 31.3% |
| Immigrants | El Salvador | 0.1 /100 | #286 | Tragic 31.3% |
| Ottawa | 0.1 /100 | #287 | Tragic 31.1% |
| Guatemalans | 0.1 /100 | #288 | Tragic 31.0% |
| Puerto Ricans | 0.1 /100 | #289 | Tragic 31.0% |
| Immigrants | Honduras | 0.1 /100 | #290 | Tragic 30.9% |