Immigrants from Congo vs Honduran Median Family Income
COMPARE
Immigrants from Congo
Honduran
Median Family Income
Median Family Income Comparison
Immigrants from Congo
Hondurans
$82,216
MEDIAN FAMILY INCOME
0.0/ 100
METRIC RATING
326th/ 347
METRIC RANK
$85,004
MEDIAN FAMILY INCOME
0.0/ 100
METRIC RATING
311th/ 347
METRIC RANK
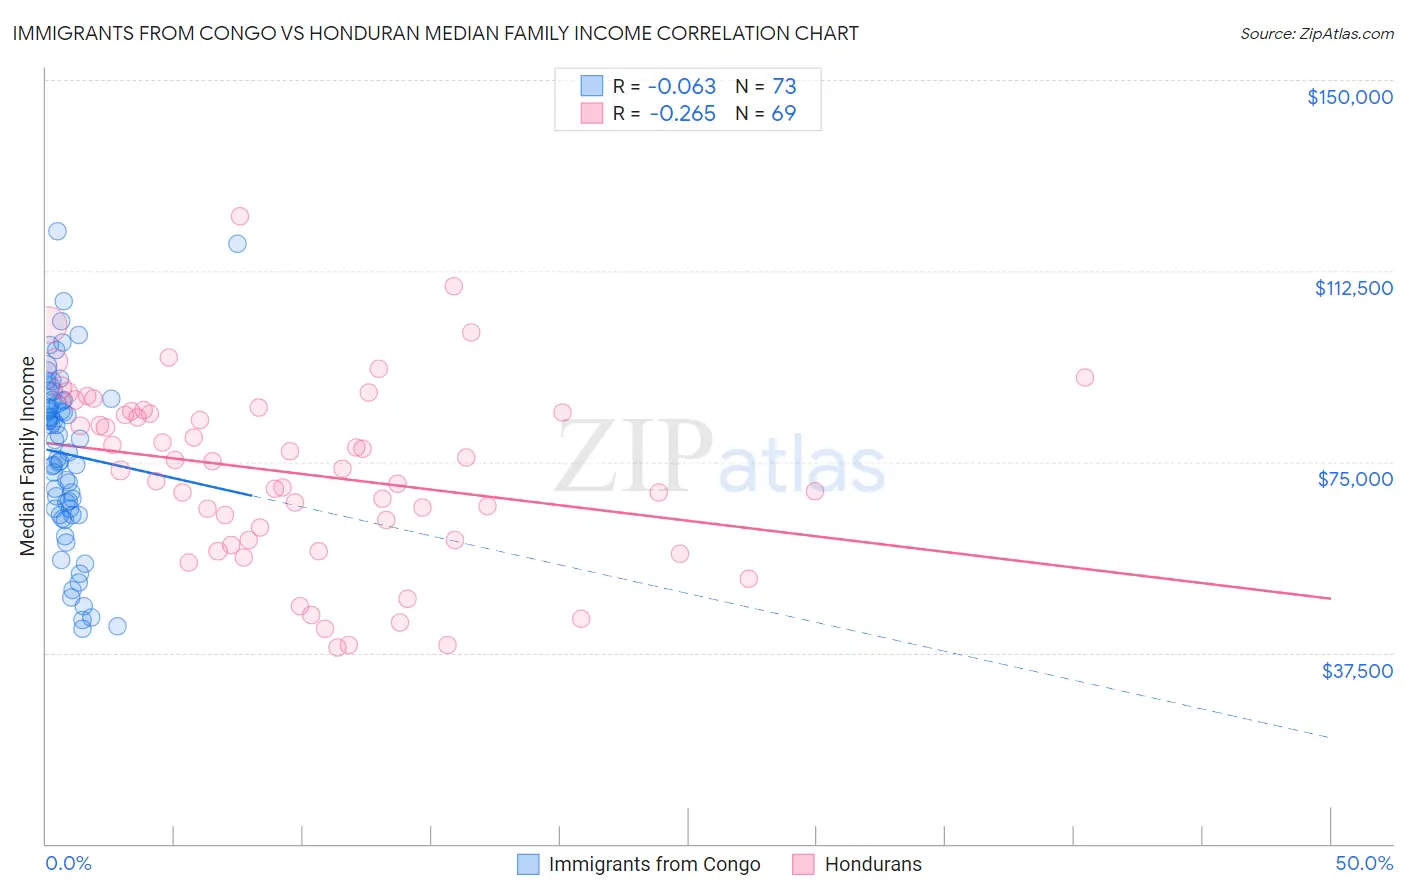
Immigrants from Congo vs Honduran Median Family Income Correlation Chart
The statistical analysis conducted on geographies consisting of 92,050,082 people shows a slight negative correlation between the proportion of Immigrants from Congo and median family income in the United States with a correlation coefficient (R) of -0.063 and weighted average of $82,216. Similarly, the statistical analysis conducted on geographies consisting of 357,506,155 people shows a weak negative correlation between the proportion of Hondurans and median family income in the United States with a correlation coefficient (R) of -0.265 and weighted average of $85,004, a difference of 3.4%.
Median Family Income Correlation Summary
| Measurement | Immigrants from Congo | Honduran |
| Minimum | $42,229 | $38,552 |
| Maximum | $120,257 | $123,311 |
| Range | $78,028 | $84,759 |
| Mean | $76,553 | $72,692 |
| Median | $79,188 | $73,540 |
| Interquartile 25% (IQ1) | $65,174 | $59,714 |
| Interquartile 75% (IQ3) | $87,165 | $84,854 |
| Interquartile Range (IQR) | $21,991 | $25,140 |
| Standard Deviation (Sample) | $17,096 | $17,679 |
| Standard Deviation (Population) | $16,978 | $17,550 |
Demographics Similar to Immigrants from Congo and Hondurans by Median Family Income
In terms of median family income, the demographic groups most similar to Immigrants from Congo are Arapaho ($82,064, a difference of 0.19%), Sioux ($82,386, a difference of 0.21%), Black/African American ($81,912, a difference of 0.37%), Creek ($82,560, a difference of 0.42%), and Bahamian ($82,631, a difference of 0.51%). Similarly, the demographic groups most similar to Hondurans are Cuban ($84,981, a difference of 0.030%), Immigrants from Central America ($85,050, a difference of 0.050%), Choctaw ($84,835, a difference of 0.20%), Haitian ($85,218, a difference of 0.25%), and Immigrants from Bahamas ($84,732, a difference of 0.32%).
| Demographics | Rating | Rank | Median Family Income |
| U.S. Virgin Islanders | 0.0 /100 | #308 | Tragic $85,294 |
| Haitians | 0.0 /100 | #309 | Tragic $85,218 |
| Immigrants | Central America | 0.0 /100 | #310 | Tragic $85,050 |
| Hondurans | 0.0 /100 | #311 | Tragic $85,004 |
| Cubans | 0.0 /100 | #312 | Tragic $84,981 |
| Choctaw | 0.0 /100 | #313 | Tragic $84,835 |
| Immigrants | Bahamas | 0.0 /100 | #314 | Tragic $84,732 |
| Apache | 0.0 /100 | #315 | Tragic $84,451 |
| Immigrants | Haiti | 0.0 /100 | #316 | Tragic $84,018 |
| Yakama | 0.0 /100 | #317 | Tragic $83,932 |
| Immigrants | Mexico | 0.0 /100 | #318 | Tragic $83,639 |
| Immigrants | Honduras | 0.0 /100 | #319 | Tragic $83,618 |
| Seminole | 0.0 /100 | #320 | Tragic $83,354 |
| Immigrants | Caribbean | 0.0 /100 | #321 | Tragic $83,319 |
| Dominicans | 0.0 /100 | #322 | Tragic $82,888 |
| Bahamians | 0.0 /100 | #323 | Tragic $82,631 |
| Creek | 0.0 /100 | #324 | Tragic $82,560 |
| Sioux | 0.0 /100 | #325 | Tragic $82,386 |
| Immigrants | Congo | 0.0 /100 | #326 | Tragic $82,216 |
| Arapaho | 0.0 /100 | #327 | Tragic $82,064 |
| Blacks/African Americans | 0.0 /100 | #328 | Tragic $81,912 |