Immigrants from Congo vs Honduran Disability Age 65 to 74
COMPARE
Immigrants from Congo
Honduran
Disability Age 65 to 74
Disability Age 65 to 74 Comparison
Immigrants from Congo
Hondurans
26.0%
DISABILITY AGE 65 TO 74
0.0/ 100
METRIC RATING
285th/ 347
METRIC RANK
25.8%
DISABILITY AGE 65 TO 74
0.1/ 100
METRIC RATING
275th/ 347
METRIC RANK
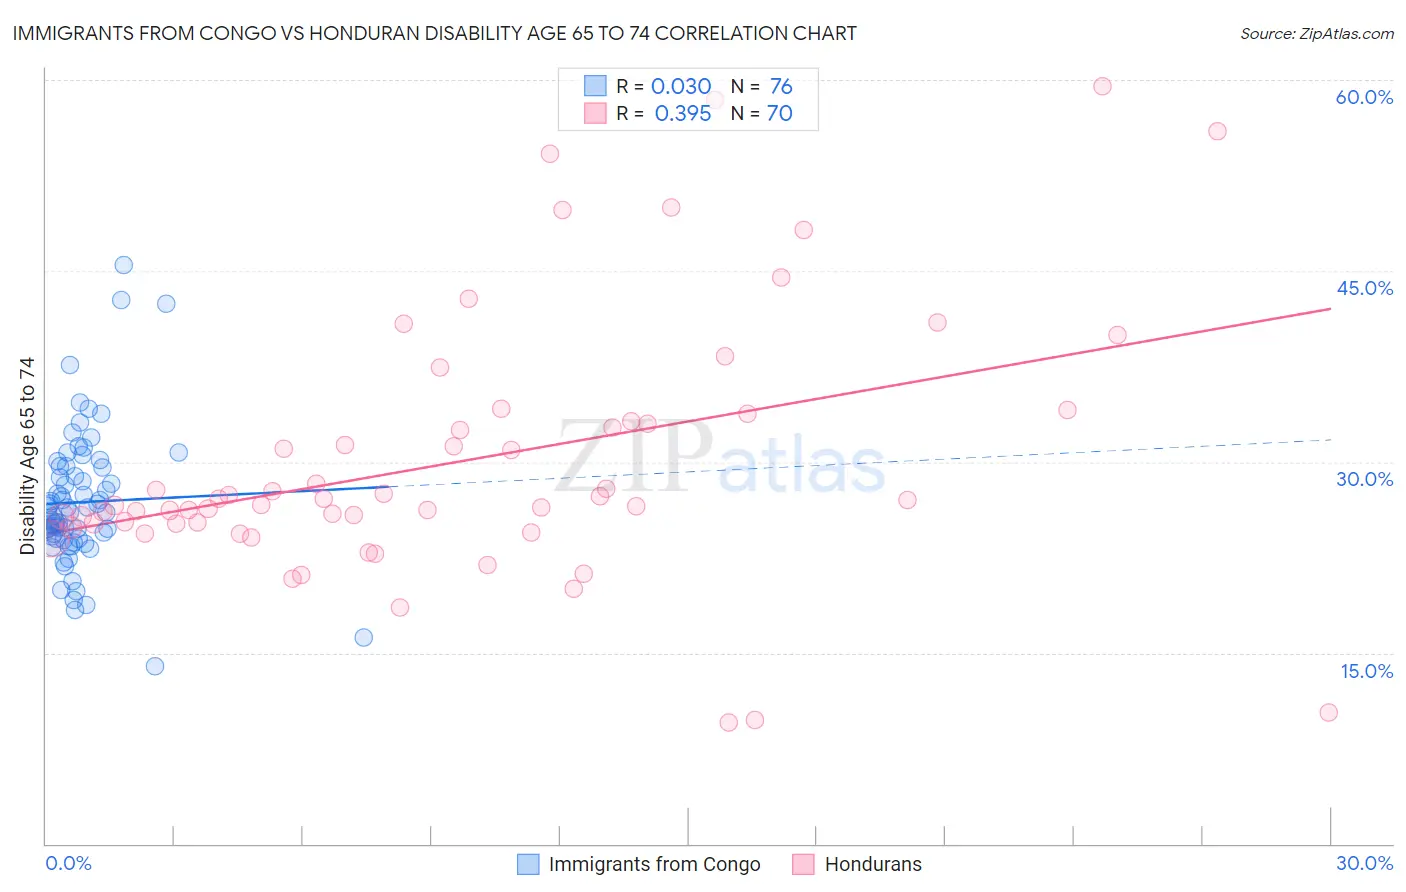
Immigrants from Congo vs Honduran Disability Age 65 to 74 Correlation Chart
The statistical analysis conducted on geographies consisting of 92,066,096 people shows no correlation between the proportion of Immigrants from Congo and percentage of population with a disability between the ages 65 and 75 in the United States with a correlation coefficient (R) of 0.030 and weighted average of 26.0%. Similarly, the statistical analysis conducted on geographies consisting of 357,197,104 people shows a mild positive correlation between the proportion of Hondurans and percentage of population with a disability between the ages 65 and 75 in the United States with a correlation coefficient (R) of 0.395 and weighted average of 25.8%, a difference of 0.73%.
Disability Age 65 to 74 Correlation Summary
| Measurement | Immigrants from Congo | Honduran |
| Minimum | 14.0% | 9.5% |
| Maximum | 45.5% | 59.5% |
| Range | 31.5% | 50.0% |
| Mean | 26.8% | 30.1% |
| Median | 26.1% | 26.8% |
| Interquartile 25% (IQ1) | 24.0% | 25.2% |
| Interquartile 75% (IQ3) | 29.6% | 33.2% |
| Interquartile Range (IQR) | 5.6% | 8.0% |
| Standard Deviation (Sample) | 5.4% | 10.4% |
| Standard Deviation (Population) | 5.4% | 10.3% |
Demographics Similar to Immigrants from Congo and Hondurans by Disability Age 65 to 74
In terms of disability age 65 to 74, the demographic groups most similar to Immigrants from Congo are Immigrants from the Azores (26.0%, a difference of 0.020%), Spanish American (25.9%, a difference of 0.21%), Delaware (25.9%, a difference of 0.35%), Immigrants from Honduras (25.9%, a difference of 0.42%), and Immigrants from Micronesia (26.1%, a difference of 0.43%). Similarly, the demographic groups most similar to Hondurans are American (25.8%, a difference of 0.010%), French American Indian (25.8%, a difference of 0.010%), Belizean (25.8%, a difference of 0.10%), Immigrants from Belize (25.8%, a difference of 0.13%), and U.S. Virgin Islander (25.9%, a difference of 0.21%).
| Demographics | Rating | Rank | Disability Age 65 to 74 |
| Immigrants | Guatemala | 0.1 /100 | #270 | Tragic 25.7% |
| Immigrants | Liberia | 0.1 /100 | #271 | Tragic 25.7% |
| Immigrants | Dominica | 0.1 /100 | #272 | Tragic 25.7% |
| Japanese | 0.1 /100 | #273 | Tragic 25.7% |
| Americans | 0.1 /100 | #274 | Tragic 25.8% |
| Hondurans | 0.1 /100 | #275 | Tragic 25.8% |
| French American Indians | 0.1 /100 | #276 | Tragic 25.8% |
| Belizeans | 0.1 /100 | #277 | Tragic 25.8% |
| Immigrants | Belize | 0.1 /100 | #278 | Tragic 25.8% |
| U.S. Virgin Islanders | 0.1 /100 | #279 | Tragic 25.9% |
| Cree | 0.1 /100 | #280 | Tragic 25.9% |
| Immigrants | Honduras | 0.1 /100 | #281 | Tragic 25.9% |
| Delaware | 0.1 /100 | #282 | Tragic 25.9% |
| Spanish Americans | 0.0 /100 | #283 | Tragic 25.9% |
| Immigrants | Azores | 0.0 /100 | #284 | Tragic 26.0% |
| Immigrants | Congo | 0.0 /100 | #285 | Tragic 26.0% |
| Immigrants | Micronesia | 0.0 /100 | #286 | Tragic 26.1% |
| Immigrants | Laos | 0.0 /100 | #287 | Tragic 26.1% |
| Mexican American Indians | 0.0 /100 | #288 | Tragic 26.2% |
| Africans | 0.0 /100 | #289 | Tragic 26.2% |
| Immigrants | Cabo Verde | 0.0 /100 | #290 | Tragic 26.3% |