Immigrants from Congo vs Egyptian Bachelor's Degree
COMPARE
Immigrants from Congo
Egyptian
Bachelor's Degree
Bachelor's Degree Comparison
Immigrants from Congo
Egyptians
33.6%
BACHELOR'S DEGREE
1.0/ 100
METRIC RATING
247th/ 347
METRIC RANK
43.3%
BACHELOR'S DEGREE
99.7/ 100
METRIC RATING
67th/ 347
METRIC RANK
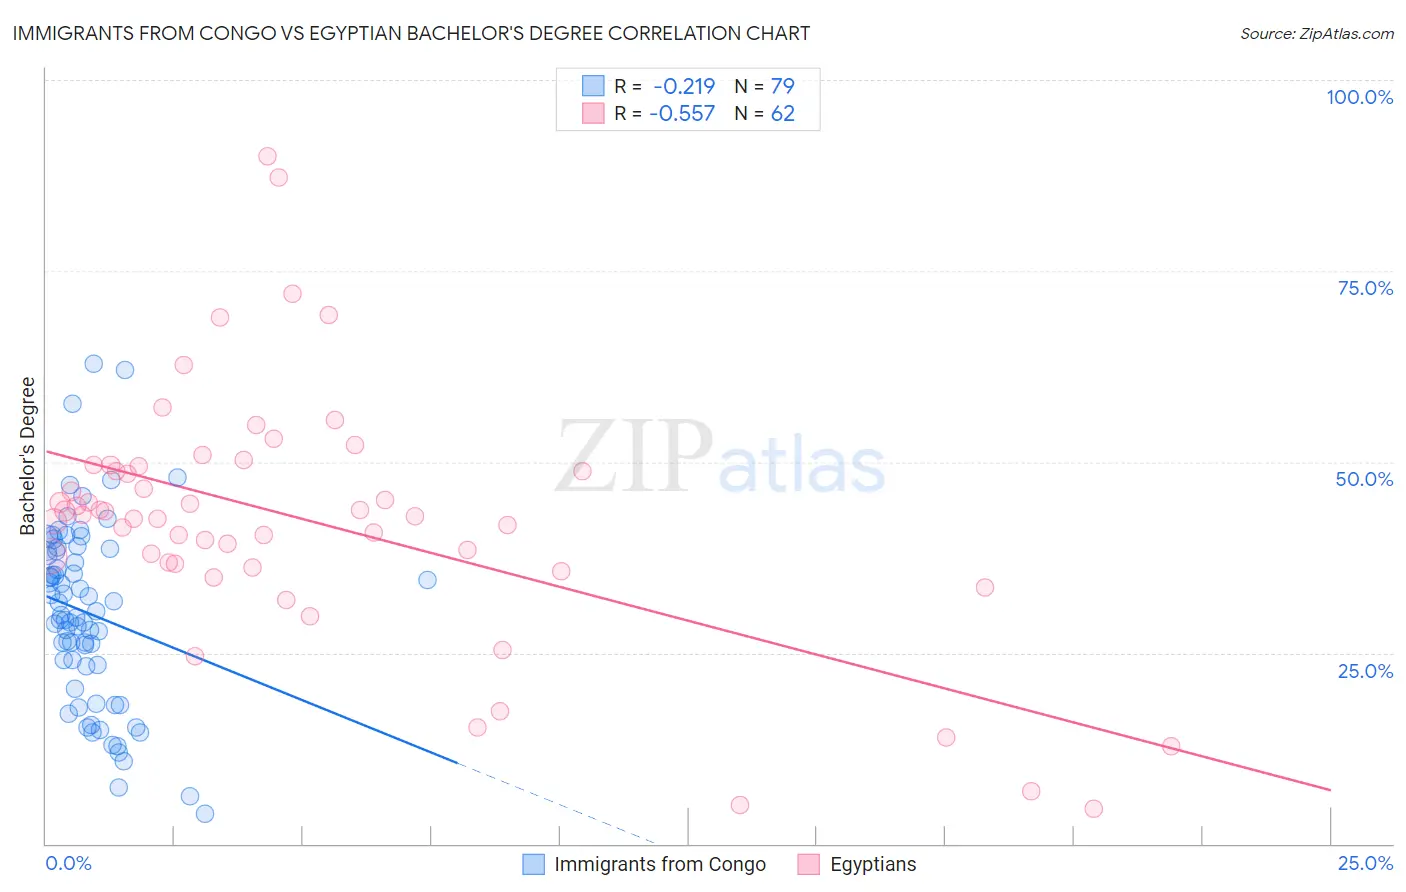
Immigrants from Congo vs Egyptian Bachelor's Degree Correlation Chart
The statistical analysis conducted on geographies consisting of 92,128,050 people shows a weak negative correlation between the proportion of Immigrants from Congo and percentage of population with at least bachelor's degree education in the United States with a correlation coefficient (R) of -0.219 and weighted average of 33.6%. Similarly, the statistical analysis conducted on geographies consisting of 276,908,448 people shows a substantial negative correlation between the proportion of Egyptians and percentage of population with at least bachelor's degree education in the United States with a correlation coefficient (R) of -0.557 and weighted average of 43.3%, a difference of 28.8%.
Bachelor's Degree Correlation Summary
| Measurement | Immigrants from Congo | Egyptian |
| Minimum | 3.9% | 4.6% |
| Maximum | 62.9% | 90.0% |
| Range | 59.0% | 85.4% |
| Mean | 30.2% | 42.3% |
| Median | 30.0% | 43.0% |
| Interquartile 25% (IQ1) | 23.3% | 36.6% |
| Interquartile 75% (IQ3) | 38.4% | 49.5% |
| Interquartile Range (IQR) | 15.1% | 12.8% |
| Standard Deviation (Sample) | 12.1% | 16.5% |
| Standard Deviation (Population) | 12.0% | 16.3% |
Similar Demographics by Bachelor's Degree
Demographics Similar to Immigrants from Congo by Bachelor's Degree
In terms of bachelor's degree, the demographic groups most similar to Immigrants from Congo are Cree (33.6%, a difference of 0.010%), Jamaican (33.6%, a difference of 0.090%), Immigrants from Liberia (33.5%, a difference of 0.14%), Indonesian (33.5%, a difference of 0.15%), and Immigrants from Fiji (33.7%, a difference of 0.45%).
| Demographics | Rating | Rank | Bachelor's Degree |
| Tongans | 2.0 /100 | #240 | Tragic 34.3% |
| Immigrants | Cambodia | 1.9 /100 | #241 | Tragic 34.2% |
| Immigrants | Nonimmigrants | 1.8 /100 | #242 | Tragic 34.2% |
| Immigrants | Guyana | 1.4 /100 | #243 | Tragic 33.9% |
| Delaware | 1.2 /100 | #244 | Tragic 33.8% |
| Immigrants | Fiji | 1.2 /100 | #245 | Tragic 33.7% |
| Jamaicans | 1.0 /100 | #246 | Tragic 33.6% |
| Immigrants | Congo | 1.0 /100 | #247 | Tragic 33.6% |
| Cree | 1.0 /100 | #248 | Tragic 33.6% |
| Immigrants | Liberia | 0.9 /100 | #249 | Tragic 33.5% |
| Indonesians | 0.9 /100 | #250 | Tragic 33.5% |
| Japanese | 0.7 /100 | #251 | Tragic 33.3% |
| Immigrants | Bahamas | 0.7 /100 | #252 | Tragic 33.3% |
| U.S. Virgin Islanders | 0.7 /100 | #253 | Tragic 33.2% |
| Native Hawaiians | 0.7 /100 | #254 | Tragic 33.2% |
Demographics Similar to Egyptians by Bachelor's Degree
In terms of bachelor's degree, the demographic groups most similar to Egyptians are Immigrants from Netherlands (43.3%, a difference of 0.020%), Immigrants from Indonesia (43.3%, a difference of 0.020%), Zimbabwean (43.3%, a difference of 0.040%), Argentinean (43.3%, a difference of 0.050%), and Immigrants from Pakistan (43.1%, a difference of 0.28%).
| Demographics | Rating | Rank | Bachelor's Degree |
| New Zealanders | 99.9 /100 | #60 | Exceptional 44.0% |
| South Africans | 99.8 /100 | #61 | Exceptional 43.6% |
| Immigrants | Kazakhstan | 99.8 /100 | #62 | Exceptional 43.4% |
| Immigrants | Europe | 99.8 /100 | #63 | Exceptional 43.4% |
| Argentineans | 99.7 /100 | #64 | Exceptional 43.3% |
| Zimbabweans | 99.7 /100 | #65 | Exceptional 43.3% |
| Immigrants | Netherlands | 99.7 /100 | #66 | Exceptional 43.3% |
| Egyptians | 99.7 /100 | #67 | Exceptional 43.3% |
| Immigrants | Indonesia | 99.7 /100 | #68 | Exceptional 43.3% |
| Immigrants | Pakistan | 99.7 /100 | #69 | Exceptional 43.1% |
| Immigrants | Romania | 99.6 /100 | #70 | Exceptional 42.9% |
| Immigrants | Argentina | 99.6 /100 | #71 | Exceptional 42.8% |
| Ethiopians | 99.5 /100 | #72 | Exceptional 42.8% |
| Immigrants | Uzbekistan | 99.5 /100 | #73 | Exceptional 42.8% |
| Bhutanese | 99.5 /100 | #74 | Exceptional 42.7% |