Immigrants from Congo vs Menominee Bachelor's Degree
COMPARE
Immigrants from Congo
Menominee
Bachelor's Degree
Bachelor's Degree Comparison
Immigrants from Congo
Menominee
33.6%
BACHELOR'S DEGREE
1.0/ 100
METRIC RATING
247th/ 347
METRIC RANK
27.3%
BACHELOR'S DEGREE
0.0/ 100
METRIC RATING
332nd/ 347
METRIC RANK
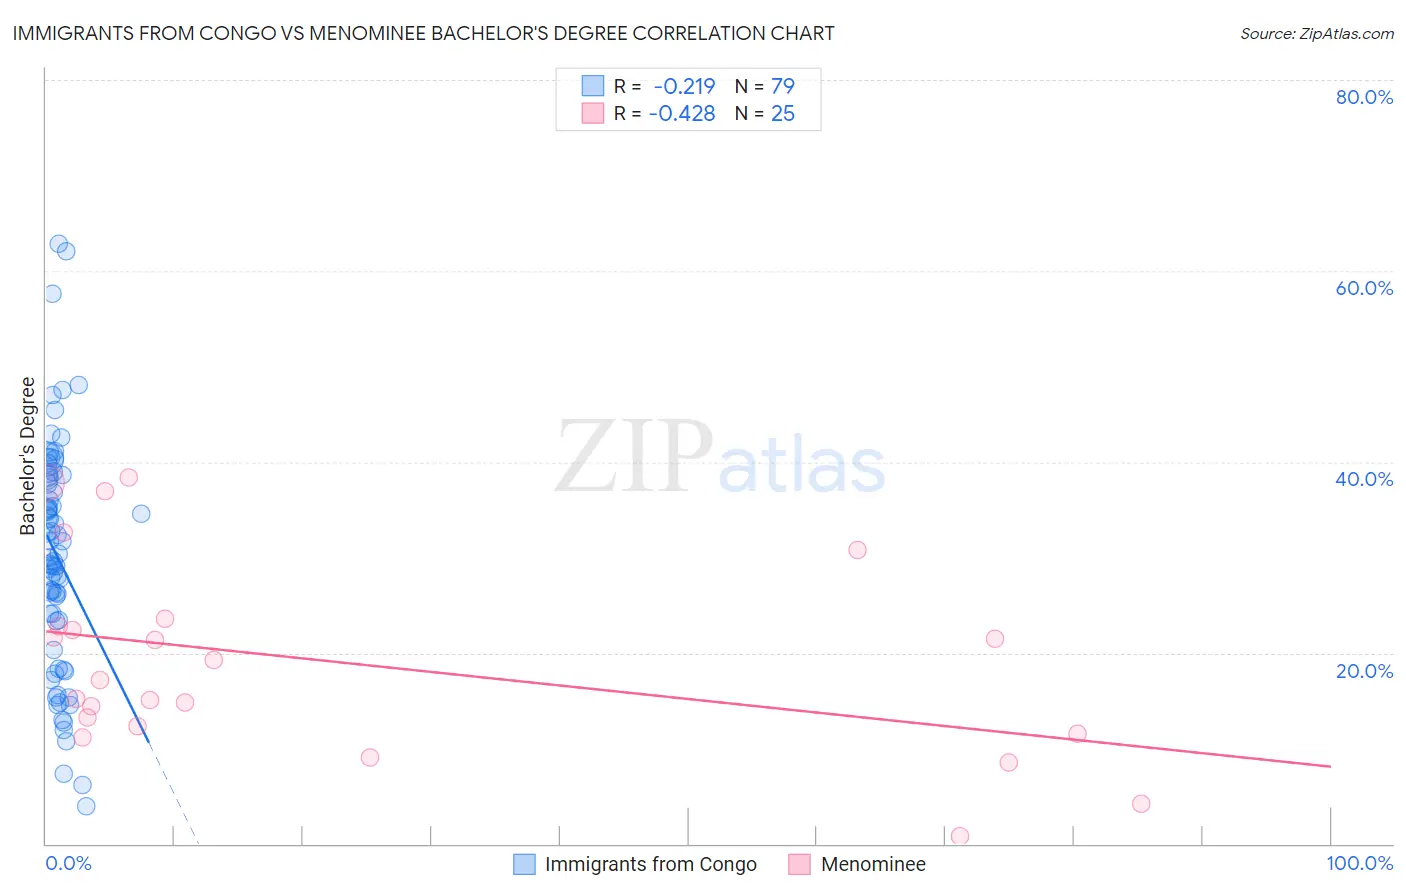
Immigrants from Congo vs Menominee Bachelor's Degree Correlation Chart
The statistical analysis conducted on geographies consisting of 92,128,050 people shows a weak negative correlation between the proportion of Immigrants from Congo and percentage of population with at least bachelor's degree education in the United States with a correlation coefficient (R) of -0.219 and weighted average of 33.6%. Similarly, the statistical analysis conducted on geographies consisting of 45,778,829 people shows a moderate negative correlation between the proportion of Menominee and percentage of population with at least bachelor's degree education in the United States with a correlation coefficient (R) of -0.428 and weighted average of 27.3%, a difference of 23.1%.
Bachelor's Degree Correlation Summary
| Measurement | Immigrants from Congo | Menominee |
| Minimum | 3.9% | 0.82% |
| Maximum | 62.9% | 38.4% |
| Range | 59.0% | 37.6% |
| Mean | 30.2% | 19.1% |
| Median | 30.0% | 17.1% |
| Interquartile 25% (IQ1) | 23.3% | 12.0% |
| Interquartile 75% (IQ3) | 38.4% | 23.1% |
| Interquartile Range (IQR) | 15.1% | 11.2% |
| Standard Deviation (Sample) | 12.1% | 10.1% |
| Standard Deviation (Population) | 12.0% | 9.9% |
Similar Demographics by Bachelor's Degree
Demographics Similar to Immigrants from Congo by Bachelor's Degree
In terms of bachelor's degree, the demographic groups most similar to Immigrants from Congo are Cree (33.6%, a difference of 0.010%), Jamaican (33.6%, a difference of 0.090%), Immigrants from Liberia (33.5%, a difference of 0.14%), Indonesian (33.5%, a difference of 0.15%), and Immigrants from Fiji (33.7%, a difference of 0.45%).
| Demographics | Rating | Rank | Bachelor's Degree |
| Tongans | 2.0 /100 | #240 | Tragic 34.3% |
| Immigrants | Cambodia | 1.9 /100 | #241 | Tragic 34.2% |
| Immigrants | Nonimmigrants | 1.8 /100 | #242 | Tragic 34.2% |
| Immigrants | Guyana | 1.4 /100 | #243 | Tragic 33.9% |
| Delaware | 1.2 /100 | #244 | Tragic 33.8% |
| Immigrants | Fiji | 1.2 /100 | #245 | Tragic 33.7% |
| Jamaicans | 1.0 /100 | #246 | Tragic 33.6% |
| Immigrants | Congo | 1.0 /100 | #247 | Tragic 33.6% |
| Cree | 1.0 /100 | #248 | Tragic 33.6% |
| Immigrants | Liberia | 0.9 /100 | #249 | Tragic 33.5% |
| Indonesians | 0.9 /100 | #250 | Tragic 33.5% |
| Japanese | 0.7 /100 | #251 | Tragic 33.3% |
| Immigrants | Bahamas | 0.7 /100 | #252 | Tragic 33.3% |
| U.S. Virgin Islanders | 0.7 /100 | #253 | Tragic 33.2% |
| Native Hawaiians | 0.7 /100 | #254 | Tragic 33.2% |
Demographics Similar to Menominee by Bachelor's Degree
In terms of bachelor's degree, the demographic groups most similar to Menominee are Immigrants from the Azores (27.3%, a difference of 0.10%), Spanish American Indian (27.5%, a difference of 0.58%), Immigrants from Central America (27.5%, a difference of 0.64%), Mexican (27.1%, a difference of 0.82%), and Crow (27.7%, a difference of 1.7%).
| Demographics | Rating | Rank | Bachelor's Degree |
| Pennsylvania Germans | 0.0 /100 | #325 | Tragic 28.4% |
| Apache | 0.0 /100 | #326 | Tragic 28.3% |
| Paiute | 0.0 /100 | #327 | Tragic 28.1% |
| Crow | 0.0 /100 | #328 | Tragic 27.7% |
| Immigrants | Central America | 0.0 /100 | #329 | Tragic 27.5% |
| Spanish American Indians | 0.0 /100 | #330 | Tragic 27.5% |
| Immigrants | Azores | 0.0 /100 | #331 | Tragic 27.3% |
| Menominee | 0.0 /100 | #332 | Tragic 27.3% |
| Mexicans | 0.0 /100 | #333 | Tragic 27.1% |
| Arapaho | 0.0 /100 | #334 | Tragic 26.6% |
| Natives/Alaskans | 0.0 /100 | #335 | Tragic 26.3% |
| Immigrants | Mexico | 0.0 /100 | #336 | Tragic 26.1% |
| Inupiat | 0.0 /100 | #337 | Tragic 25.8% |
| Pueblo | 0.0 /100 | #338 | Tragic 25.5% |
| Hopi | 0.0 /100 | #339 | Tragic 25.3% |