Immigrants from Congo vs Arab Bachelor's Degree
COMPARE
Immigrants from Congo
Arab
Bachelor's Degree
Bachelor's Degree Comparison
Immigrants from Congo
Arabs
33.6%
BACHELOR'S DEGREE
1.0/ 100
METRIC RATING
247th/ 347
METRIC RANK
40.9%
BACHELOR'S DEGREE
96.6/ 100
METRIC RATING
109th/ 347
METRIC RANK
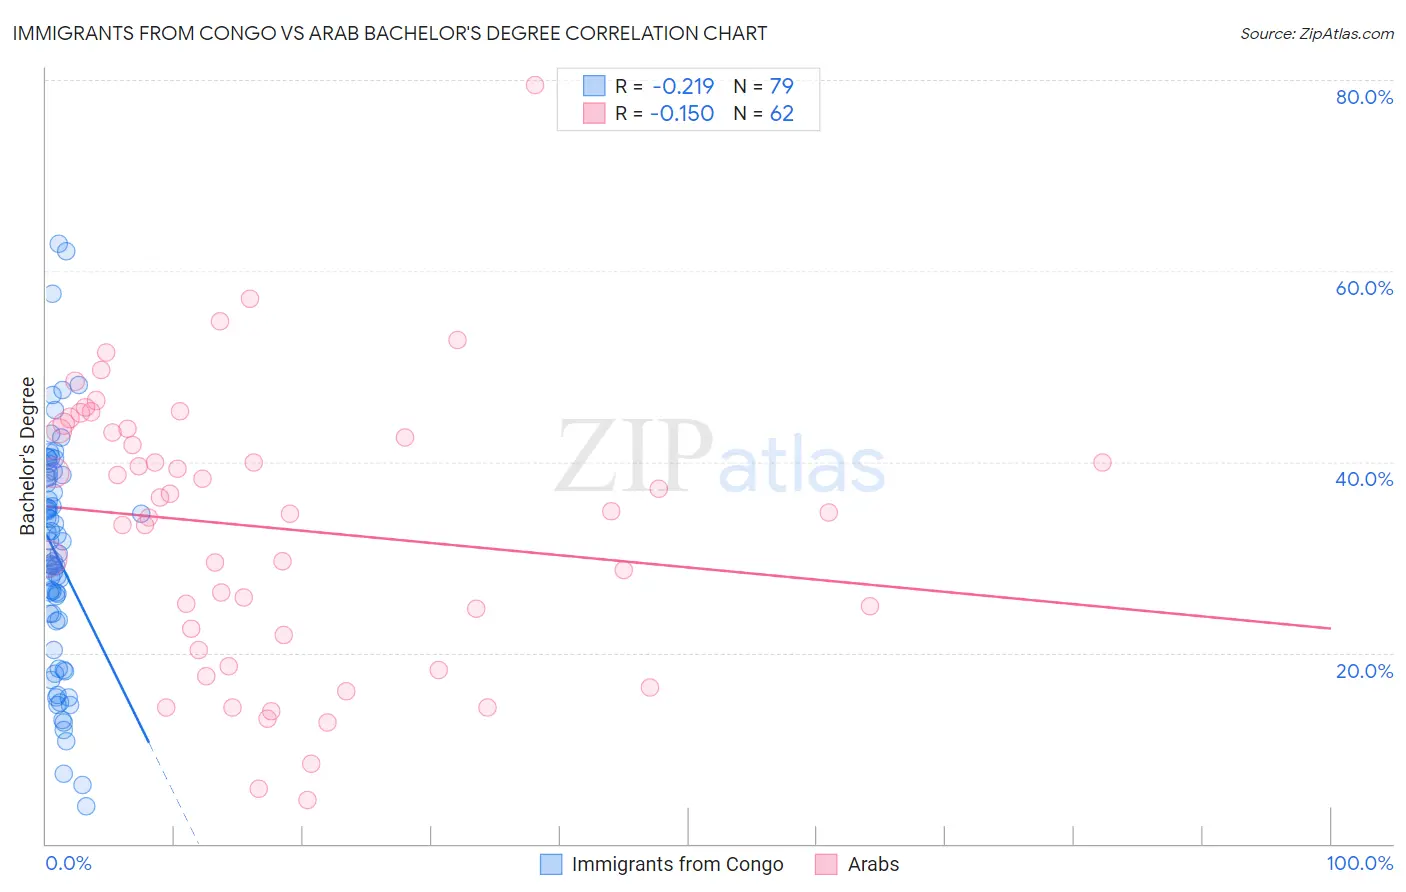
Immigrants from Congo vs Arab Bachelor's Degree Correlation Chart
The statistical analysis conducted on geographies consisting of 92,128,050 people shows a weak negative correlation between the proportion of Immigrants from Congo and percentage of population with at least bachelor's degree education in the United States with a correlation coefficient (R) of -0.219 and weighted average of 33.6%. Similarly, the statistical analysis conducted on geographies consisting of 486,810,717 people shows a poor negative correlation between the proportion of Arabs and percentage of population with at least bachelor's degree education in the United States with a correlation coefficient (R) of -0.150 and weighted average of 40.9%, a difference of 21.8%.
Bachelor's Degree Correlation Summary
| Measurement | Immigrants from Congo | Arab |
| Minimum | 3.9% | 4.6% |
| Maximum | 62.9% | 79.5% |
| Range | 59.0% | 74.9% |
| Mean | 30.2% | 33.1% |
| Median | 30.0% | 34.8% |
| Interquartile 25% (IQ1) | 23.3% | 21.9% |
| Interquartile 75% (IQ3) | 38.4% | 43.2% |
| Interquartile Range (IQR) | 15.1% | 21.4% |
| Standard Deviation (Sample) | 12.1% | 14.4% |
| Standard Deviation (Population) | 12.0% | 14.3% |
Similar Demographics by Bachelor's Degree
Demographics Similar to Immigrants from Congo by Bachelor's Degree
In terms of bachelor's degree, the demographic groups most similar to Immigrants from Congo are Cree (33.6%, a difference of 0.010%), Jamaican (33.6%, a difference of 0.090%), Immigrants from Liberia (33.5%, a difference of 0.14%), Indonesian (33.5%, a difference of 0.15%), and Immigrants from Fiji (33.7%, a difference of 0.45%).
| Demographics | Rating | Rank | Bachelor's Degree |
| Tongans | 2.0 /100 | #240 | Tragic 34.3% |
| Immigrants | Cambodia | 1.9 /100 | #241 | Tragic 34.2% |
| Immigrants | Nonimmigrants | 1.8 /100 | #242 | Tragic 34.2% |
| Immigrants | Guyana | 1.4 /100 | #243 | Tragic 33.9% |
| Delaware | 1.2 /100 | #244 | Tragic 33.8% |
| Immigrants | Fiji | 1.2 /100 | #245 | Tragic 33.7% |
| Jamaicans | 1.0 /100 | #246 | Tragic 33.6% |
| Immigrants | Congo | 1.0 /100 | #247 | Tragic 33.6% |
| Cree | 1.0 /100 | #248 | Tragic 33.6% |
| Immigrants | Liberia | 0.9 /100 | #249 | Tragic 33.5% |
| Indonesians | 0.9 /100 | #250 | Tragic 33.5% |
| Japanese | 0.7 /100 | #251 | Tragic 33.3% |
| Immigrants | Bahamas | 0.7 /100 | #252 | Tragic 33.3% |
| U.S. Virgin Islanders | 0.7 /100 | #253 | Tragic 33.2% |
| Native Hawaiians | 0.7 /100 | #254 | Tragic 33.2% |
Demographics Similar to Arabs by Bachelor's Degree
In terms of bachelor's degree, the demographic groups most similar to Arabs are Ukrainian (40.9%, a difference of 0.020%), Albanian (40.9%, a difference of 0.080%), Immigrants from Chile (40.8%, a difference of 0.12%), Northern European (41.0%, a difference of 0.16%), and Ugandan (40.8%, a difference of 0.17%).
| Demographics | Rating | Rank | Bachelor's Degree |
| Immigrants | Italy | 97.8 /100 | #102 | Exceptional 41.3% |
| Chileans | 97.5 /100 | #103 | Exceptional 41.2% |
| Jordanians | 97.4 /100 | #104 | Exceptional 41.2% |
| Syrians | 97.4 /100 | #105 | Exceptional 41.1% |
| Alsatians | 97.0 /100 | #106 | Exceptional 41.0% |
| Northern Europeans | 96.8 /100 | #107 | Exceptional 41.0% |
| Ukrainians | 96.6 /100 | #108 | Exceptional 40.9% |
| Arabs | 96.6 /100 | #109 | Exceptional 40.9% |
| Albanians | 96.5 /100 | #110 | Exceptional 40.9% |
| Immigrants | Chile | 96.4 /100 | #111 | Exceptional 40.8% |
| Ugandans | 96.3 /100 | #112 | Exceptional 40.8% |
| Brazilians | 96.3 /100 | #113 | Exceptional 40.8% |
| Afghans | 96.2 /100 | #114 | Exceptional 40.8% |
| Palestinians | 95.8 /100 | #115 | Exceptional 40.7% |
| Immigrants | Uganda | 95.7 /100 | #116 | Exceptional 40.7% |