Nicaraguan vs Chilean Bachelor's Degree
COMPARE
Nicaraguan
Chilean
Bachelor's Degree
Bachelor's Degree Comparison
Nicaraguans
Chileans
33.1%
BACHELOR'S DEGREE
0.6/ 100
METRIC RATING
256th/ 347
METRIC RANK
41.2%
BACHELOR'S DEGREE
97.5/ 100
METRIC RATING
103rd/ 347
METRIC RANK
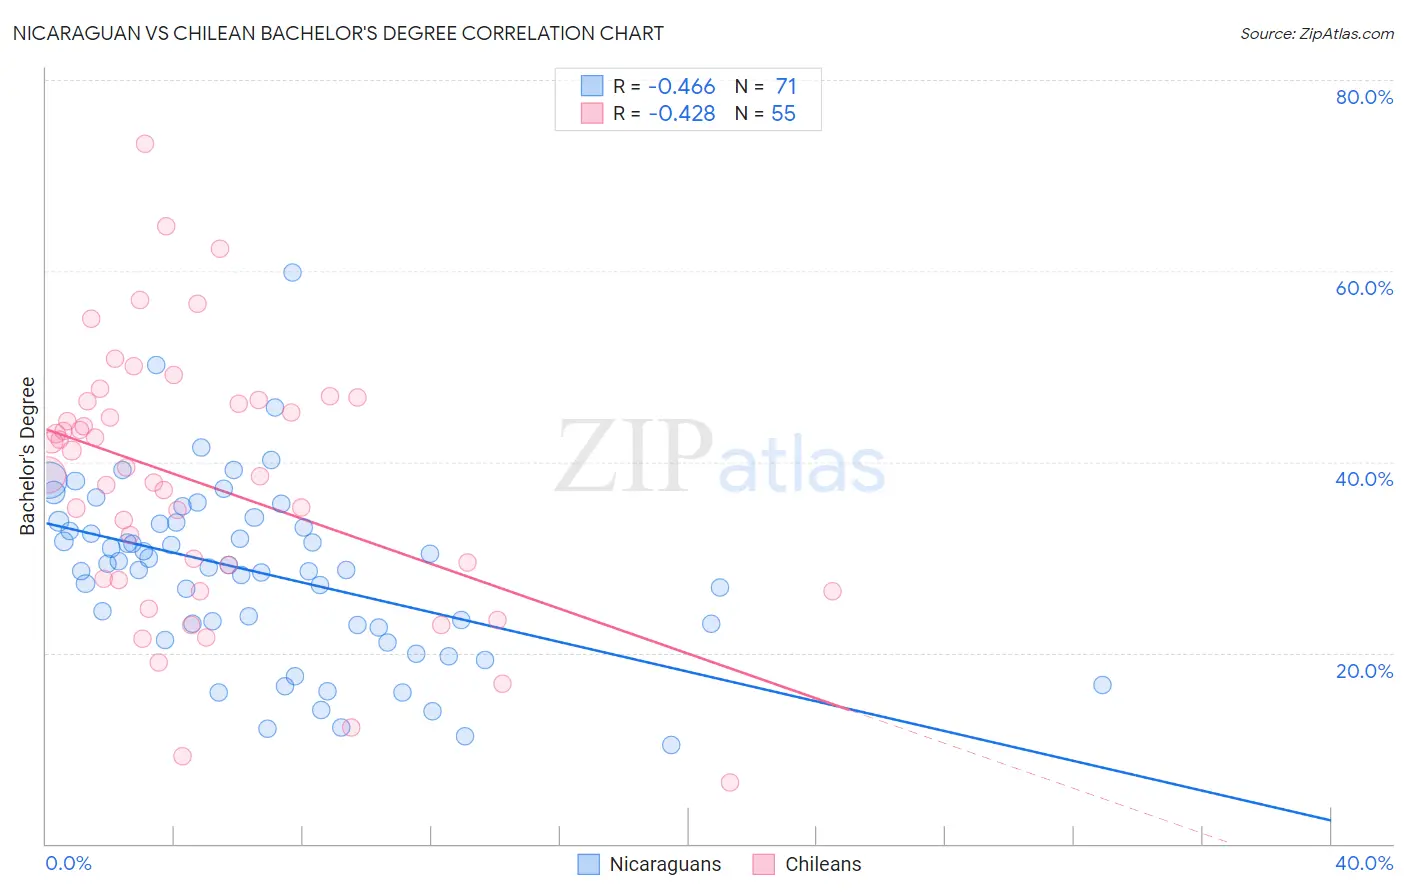
Nicaraguan vs Chilean Bachelor's Degree Correlation Chart
The statistical analysis conducted on geographies consisting of 285,704,287 people shows a moderate negative correlation between the proportion of Nicaraguans and percentage of population with at least bachelor's degree education in the United States with a correlation coefficient (R) of -0.466 and weighted average of 33.1%. Similarly, the statistical analysis conducted on geographies consisting of 256,683,612 people shows a moderate negative correlation between the proportion of Chileans and percentage of population with at least bachelor's degree education in the United States with a correlation coefficient (R) of -0.428 and weighted average of 41.2%, a difference of 24.2%.
Bachelor's Degree Correlation Summary
| Measurement | Nicaraguan | Chilean |
| Minimum | 10.4% | 6.5% |
| Maximum | 59.8% | 73.3% |
| Range | 49.4% | 66.8% |
| Mean | 28.3% | 37.7% |
| Median | 29.0% | 38.6% |
| Interquartile 25% (IQ1) | 22.7% | 27.6% |
| Interquartile 75% (IQ3) | 33.7% | 46.4% |
| Interquartile Range (IQR) | 11.0% | 18.7% |
| Standard Deviation (Sample) | 9.3% | 13.7% |
| Standard Deviation (Population) | 9.3% | 13.6% |
Similar Demographics by Bachelor's Degree
Demographics Similar to Nicaraguans by Bachelor's Degree
In terms of bachelor's degree, the demographic groups most similar to Nicaraguans are Iroquois (33.2%, a difference of 0.19%), Native Hawaiian (33.2%, a difference of 0.20%), Spanish American (33.1%, a difference of 0.22%), French American Indian (33.1%, a difference of 0.26%), and U.S. Virgin Islander (33.2%, a difference of 0.27%).
| Demographics | Rating | Rank | Bachelor's Degree |
| Immigrants | Liberia | 0.9 /100 | #249 | Tragic 33.5% |
| Indonesians | 0.9 /100 | #250 | Tragic 33.5% |
| Japanese | 0.7 /100 | #251 | Tragic 33.3% |
| Immigrants | Bahamas | 0.7 /100 | #252 | Tragic 33.3% |
| U.S. Virgin Islanders | 0.7 /100 | #253 | Tragic 33.2% |
| Native Hawaiians | 0.7 /100 | #254 | Tragic 33.2% |
| Iroquois | 0.7 /100 | #255 | Tragic 33.2% |
| Nicaraguans | 0.6 /100 | #256 | Tragic 33.1% |
| Spanish Americans | 0.6 /100 | #257 | Tragic 33.1% |
| French American Indians | 0.6 /100 | #258 | Tragic 33.1% |
| Osage | 0.5 /100 | #259 | Tragic 33.0% |
| Malaysians | 0.5 /100 | #260 | Tragic 32.9% |
| Africans | 0.5 /100 | #261 | Tragic 32.9% |
| Immigrants | Jamaica | 0.5 /100 | #262 | Tragic 32.9% |
| Belizeans | 0.4 /100 | #263 | Tragic 32.8% |
Demographics Similar to Chileans by Bachelor's Degree
In terms of bachelor's degree, the demographic groups most similar to Chileans are Jordanian (41.2%, a difference of 0.060%), Syrian (41.1%, a difference of 0.090%), Immigrants from Italy (41.3%, a difference of 0.34%), Alsatian (41.0%, a difference of 0.35%), and Northern European (41.0%, a difference of 0.52%).
| Demographics | Rating | Rank | Bachelor's Degree |
| Immigrants | Moldova | 98.4 /100 | #96 | Exceptional 41.6% |
| Romanians | 98.4 /100 | #97 | Exceptional 41.6% |
| Immigrants | Ukraine | 98.3 /100 | #98 | Exceptional 41.5% |
| Immigrants | England | 98.1 /100 | #99 | Exceptional 41.4% |
| Macedonians | 98.1 /100 | #100 | Exceptional 41.4% |
| Immigrants | Morocco | 98.0 /100 | #101 | Exceptional 41.4% |
| Immigrants | Italy | 97.8 /100 | #102 | Exceptional 41.3% |
| Chileans | 97.5 /100 | #103 | Exceptional 41.2% |
| Jordanians | 97.4 /100 | #104 | Exceptional 41.2% |
| Syrians | 97.4 /100 | #105 | Exceptional 41.1% |
| Alsatians | 97.0 /100 | #106 | Exceptional 41.0% |
| Northern Europeans | 96.8 /100 | #107 | Exceptional 41.0% |
| Ukrainians | 96.6 /100 | #108 | Exceptional 40.9% |
| Arabs | 96.6 /100 | #109 | Exceptional 40.9% |
| Albanians | 96.5 /100 | #110 | Exceptional 40.9% |