Immigrants from Congo vs Irish Associate's Degree
COMPARE
Immigrants from Congo
Irish
Associate's Degree
Associate's Degree Comparison
Immigrants from Congo
Irish
41.8%
ASSOCIATE'S DEGREE
0.5/ 100
METRIC RATING
256th/ 347
METRIC RANK
46.5%
ASSOCIATE'S DEGREE
53.6/ 100
METRIC RATING
170th/ 347
METRIC RANK
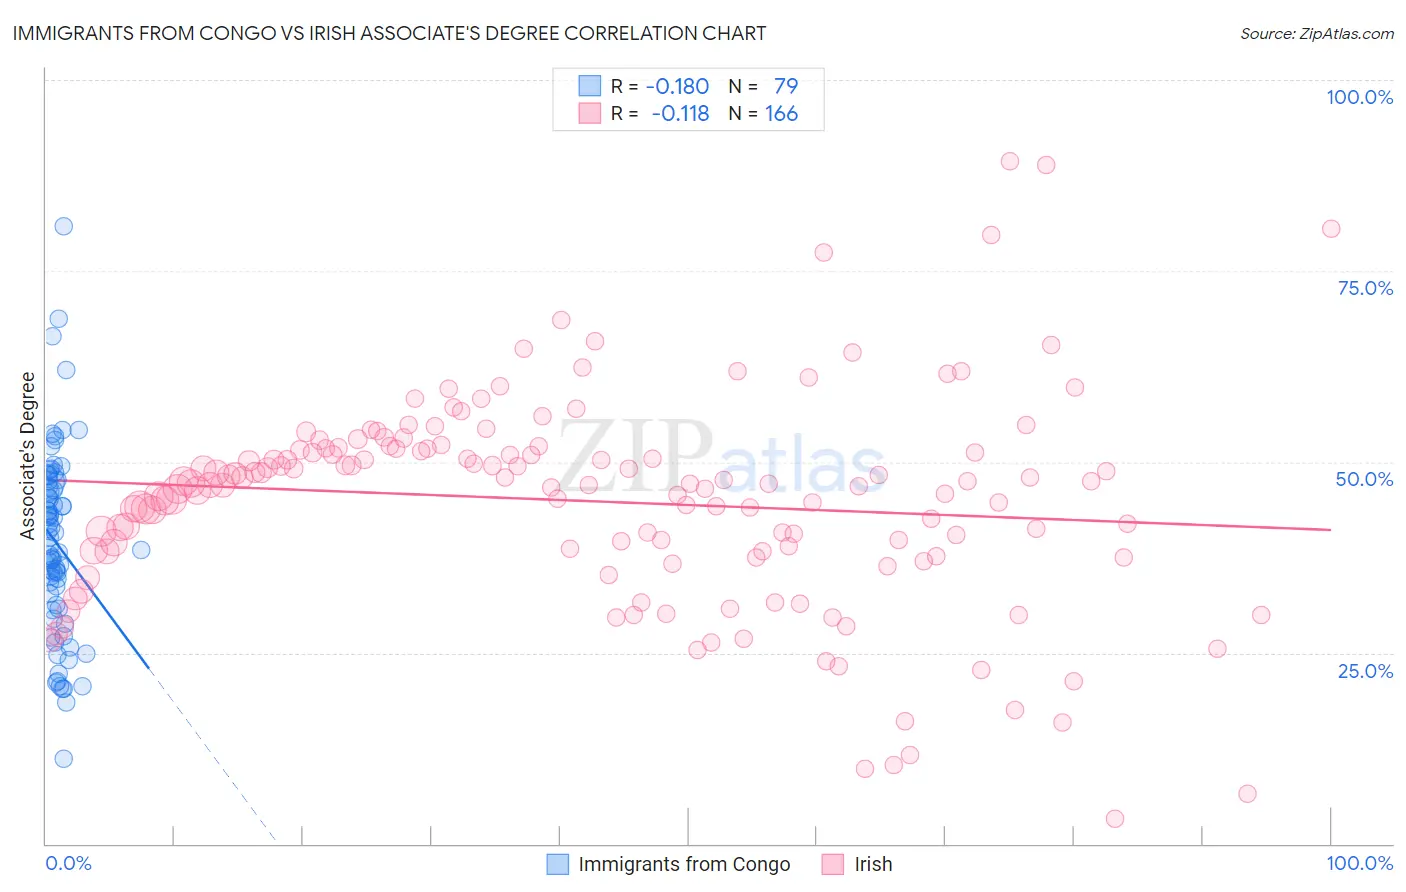
Immigrants from Congo vs Irish Associate's Degree Correlation Chart
The statistical analysis conducted on geographies consisting of 92,128,730 people shows a poor negative correlation between the proportion of Immigrants from Congo and percentage of population with at least associate's degree education in the United States with a correlation coefficient (R) of -0.180 and weighted average of 41.8%. Similarly, the statistical analysis conducted on geographies consisting of 580,555,022 people shows a poor negative correlation between the proportion of Irish and percentage of population with at least associate's degree education in the United States with a correlation coefficient (R) of -0.118 and weighted average of 46.5%, a difference of 11.2%.
Associate's Degree Correlation Summary
| Measurement | Immigrants from Congo | Irish |
| Minimum | 11.1% | 3.2% |
| Maximum | 80.9% | 89.4% |
| Range | 69.7% | 86.2% |
| Mean | 39.3% | 44.9% |
| Median | 39.0% | 47.1% |
| Interquartile 25% (IQ1) | 30.7% | 38.3% |
| Interquartile 75% (IQ3) | 47.3% | 51.7% |
| Interquartile Range (IQR) | 16.6% | 13.4% |
| Standard Deviation (Sample) | 12.3% | 13.9% |
| Standard Deviation (Population) | 12.2% | 13.9% |
Similar Demographics by Associate's Degree
Demographics Similar to Immigrants from Congo by Associate's Degree
In terms of associate's degree, the demographic groups most similar to Immigrants from Congo are Spanish American (41.8%, a difference of 0.060%), Immigrants from Guyana (41.8%, a difference of 0.12%), Cuban (41.9%, a difference of 0.21%), Japanese (41.7%, a difference of 0.27%), and Indonesian (41.9%, a difference of 0.28%).
| Demographics | Rating | Rank | Associate's Degree |
| Jamaicans | 0.7 /100 | #249 | Tragic 42.1% |
| U.S. Virgin Islanders | 0.7 /100 | #250 | Tragic 42.1% |
| Immigrants | Bahamas | 0.7 /100 | #251 | Tragic 42.1% |
| French American Indians | 0.6 /100 | #252 | Tragic 42.0% |
| Indonesians | 0.6 /100 | #253 | Tragic 41.9% |
| Cubans | 0.6 /100 | #254 | Tragic 41.9% |
| Immigrants | Guyana | 0.5 /100 | #255 | Tragic 41.8% |
| Immigrants | Congo | 0.5 /100 | #256 | Tragic 41.8% |
| Spanish Americans | 0.5 /100 | #257 | Tragic 41.8% |
| Japanese | 0.5 /100 | #258 | Tragic 41.7% |
| Malaysians | 0.4 /100 | #259 | Tragic 41.6% |
| Marshallese | 0.4 /100 | #260 | Tragic 41.6% |
| Nicaraguans | 0.4 /100 | #261 | Tragic 41.5% |
| Bahamians | 0.4 /100 | #262 | Tragic 41.5% |
| Immigrants | Jamaica | 0.3 /100 | #263 | Tragic 41.5% |
Demographics Similar to Irish by Associate's Degree
In terms of associate's degree, the demographic groups most similar to Irish are Basque (46.5%, a difference of 0.060%), Uruguayan (46.5%, a difference of 0.13%), Immigrants from Somalia (46.5%, a difference of 0.14%), Peruvian (46.4%, a difference of 0.24%), and Immigrants from Iraq (46.4%, a difference of 0.25%).
| Demographics | Rating | Rank | Associate's Degree |
| Somalis | 62.5 /100 | #163 | Good 46.8% |
| Colombians | 62.4 /100 | #164 | Good 46.8% |
| Immigrants | South America | 59.9 /100 | #165 | Average 46.7% |
| Hungarians | 59.3 /100 | #166 | Average 46.7% |
| Immigrants | Sierra Leone | 59.2 /100 | #167 | Average 46.7% |
| Immigrants | Somalia | 55.5 /100 | #168 | Average 46.5% |
| Uruguayans | 55.4 /100 | #169 | Average 46.5% |
| Irish | 53.6 /100 | #170 | Average 46.5% |
| Basques | 52.8 /100 | #171 | Average 46.5% |
| Peruvians | 50.5 /100 | #172 | Average 46.4% |
| Immigrants | Iraq | 50.3 /100 | #173 | Average 46.4% |
| English | 50.0 /100 | #174 | Average 46.4% |
| Belgians | 48.9 /100 | #175 | Average 46.3% |
| Finns | 48.5 /100 | #176 | Average 46.3% |
| Slovaks | 48.4 /100 | #177 | Average 46.3% |