Immigrants from Congo vs Belizean Receiving Food Stamps
COMPARE
Immigrants from Congo
Belizean
Receiving Food Stamps
Receiving Food Stamps Comparison
Immigrants from Congo
Belizeans
14.1%
RECEIVING FOOD STAMPS
0.3/ 100
METRIC RATING
261st/ 347
METRIC RANK
14.8%
RECEIVING FOOD STAMPS
0.1/ 100
METRIC RATING
278th/ 347
METRIC RANK
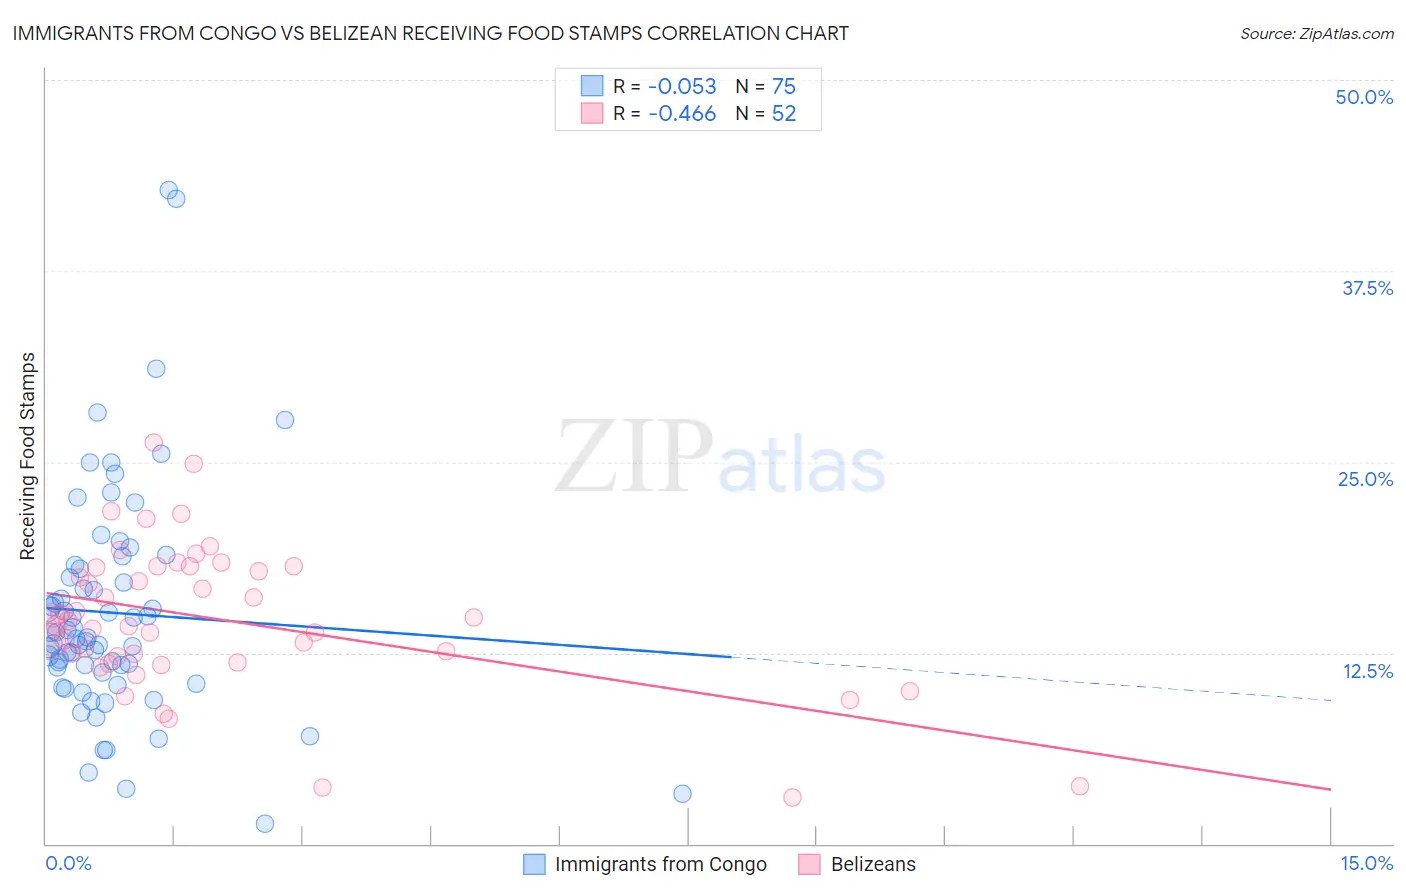
Immigrants from Congo vs Belizean Receiving Food Stamps Correlation Chart
The statistical analysis conducted on geographies consisting of 92,058,964 people shows a slight negative correlation between the proportion of Immigrants from Congo and percentage of population receiving government assistance and/or food stamps in the United States with a correlation coefficient (R) of -0.053 and weighted average of 14.1%. Similarly, the statistical analysis conducted on geographies consisting of 144,020,862 people shows a moderate negative correlation between the proportion of Belizeans and percentage of population receiving government assistance and/or food stamps in the United States with a correlation coefficient (R) of -0.466 and weighted average of 14.8%, a difference of 4.8%.
Receiving Food Stamps Correlation Summary
| Measurement | Immigrants from Congo | Belizean |
| Minimum | 1.3% | 3.0% |
| Maximum | 42.8% | 26.3% |
| Range | 41.5% | 23.3% |
| Mean | 15.1% | 14.7% |
| Median | 13.5% | 14.4% |
| Interquartile 25% (IQ1) | 11.2% | 12.1% |
| Interquartile 75% (IQ3) | 18.0% | 18.1% |
| Interquartile Range (IQR) | 6.8% | 6.0% |
| Standard Deviation (Sample) | 7.4% | 4.8% |
| Standard Deviation (Population) | 7.4% | 4.7% |
Demographics Similar to Immigrants from Congo and Belizeans by Receiving Food Stamps
In terms of receiving food stamps, the demographic groups most similar to Immigrants from Congo are Central American (14.1%, a difference of 0.010%), Creek (14.1%, a difference of 0.11%), Paiute (14.3%, a difference of 0.79%), Immigrants from Portugal (14.3%, a difference of 0.79%), and Immigrants from Uzbekistan (14.3%, a difference of 0.88%). Similarly, the demographic groups most similar to Belizeans are Seminole (14.8%, a difference of 0.13%), Liberian (14.8%, a difference of 0.18%), Kiowa (14.9%, a difference of 0.27%), Ute (14.7%, a difference of 0.89%), and Immigrants from Western Africa (14.7%, a difference of 0.97%).
| Demographics | Rating | Rank | Receiving Food Stamps |
| Creek | 0.3 /100 | #259 | Tragic 14.1% |
| Central Americans | 0.3 /100 | #260 | Tragic 14.1% |
| Immigrants | Congo | 0.3 /100 | #261 | Tragic 14.1% |
| Paiute | 0.2 /100 | #262 | Tragic 14.3% |
| Immigrants | Portugal | 0.2 /100 | #263 | Tragic 14.3% |
| Immigrants | Uzbekistan | 0.2 /100 | #264 | Tragic 14.3% |
| Blackfeet | 0.2 /100 | #265 | Tragic 14.3% |
| Cheyenne | 0.2 /100 | #266 | Tragic 14.3% |
| Dutch West Indians | 0.2 /100 | #267 | Tragic 14.3% |
| Guatemalans | 0.1 /100 | #268 | Tragic 14.4% |
| Nepalese | 0.1 /100 | #269 | Tragic 14.6% |
| Mexicans | 0.1 /100 | #270 | Tragic 14.6% |
| Immigrants | Guatemala | 0.1 /100 | #271 | Tragic 14.6% |
| Chippewa | 0.1 /100 | #272 | Tragic 14.7% |
| Alaskan Athabascans | 0.1 /100 | #273 | Tragic 14.7% |
| Immigrants | Western Africa | 0.1 /100 | #274 | Tragic 14.7% |
| Ute | 0.1 /100 | #275 | Tragic 14.7% |
| Liberians | 0.1 /100 | #276 | Tragic 14.8% |
| Seminole | 0.1 /100 | #277 | Tragic 14.8% |
| Belizeans | 0.1 /100 | #278 | Tragic 14.8% |
| Kiowa | 0.0 /100 | #279 | Tragic 14.9% |